
Kerr Financial Group
Kildare Asset Mgt.
Jeffrey J. Kerr, CFA
Newsletter
April 19, 2021 – DJIA = 34,200 – S&P 500 = 4,185– Nasdaq = 14,052
“Art for Art’s Sake”
With all of the ways that we communicate combined with the speed that it is delivered, it should be easy to keep up with everything. We have cell phones, email, text messages, social media, phone apps, and hundreds of radio and cable channels. Unfortunately, having countless ways to stay connected doesn’t equate with being informed. It often feels like we are using smoke signals while the rest of the world is telepathically in sync.
This brain bruising overload happens in all parts of our lives – news, fashion, music, sports, and, of course, the financial markets. Within recent years investors have had to deal with a flood of new things like SPACs, crypto currencies, blockchain, and NFTs. These are new and complex products and it makes some traders yearn for the simpler days that included such things as physical trading floors and handwritten orders.
For those who might be off the grid, SPACs are Special Purpose Acquisition Companies. They raise money to buy another company which is typically private which becomes an alternative method for an IPO (initial public offering). SPACs have grown in popularity and have raised a lot of money. With all this money comes risk as there is a finite number of strong buy out candidates waiting to run into the arms of a SPAC. This means that there are plenty of bad deals are being done.
Crypto currencies are digital currencies that are not controlled by any central authority. There are many versions of cryptos but Bitcoin and Ethereum are the most popular and have generated the most excitement. Blockchain is part of the crypto currency universe. It is an open ledger which is monitored and reviewed by a network of computers. Wall Street is developing strategies involving crypto currencies and related assets.
NFTs are non-fungible tokens which are a unit of data stored on a digital ledger (blockchain). NFTs are growing in the digital collectable markets and they offer a level of authenticity. NFTs do not include the copyright so duplicates can be available to anyone. NFTs can be bought and sold with all transactions being recorded on the blockchain.
NFTs have gained notoriety when Christie’s auction house recently sold a digital collage of 5,000 images for $69.3 million dollars. The image is at the top of this newsletter and the piece is entitled “Everydays: The First 5000 Days”.
These controversial financial products are difficult to understand and, perhaps, harder to analyze. SPACs indirectly fit into conventional analysis. They have a cash value prior to acquiring a company and, after the ‘de-spac’, shareholders have ownership of a company. At this point, the security is a claim on the assets, revenues, earnings, and cash flows which can be valued.
There are deep debates about how to view and evaluate cryptos and NFTs. Believers argue these are alternatives to the U.S. dollar and will ultimately become the economy’s currency. Digital bulls point out that the dollar has been under attack from the Federal Reserve and the Federal Government and has lost over 90% of its value in the last 100 years. They say the time has come for a replacement.
Crypto skeptics contend that Bitcoin, Ethereum, et. Al. will not be able to gather enough confidence to become a method of exchange. Without acceptance, it is difficult to become a store of value which is a characteristic of currencies. Many detractors believe cryptos will turn into a commodity.
Blockchain has potential to transform our lives. It has the capability to offer lower cost, transparent, and accurate record keeping. This digital data base could change the way we perform financial and legal transactions in the future. As crypto currencies are linked with blockchains, they are expected to have a role in the financial landscape.
With these possibilities in mind, bystanders could be bewildered by the price of Bitcoin and the rest of the crypto currencies. For those not following, Bitcoin’s price has moved from $10,000 last summer to over $60,000 last week. Ethereum has climbed from below $200 to over $2,500 during the same period.
In addition to all the fundamental twists and turns during the past 10 months, a fair amount of emotion has helped drive crypto prices. Crypto believers have deep faith in the future applicability and value of Bitcoin. It seems like the only thing that will dent their enthusiasm is a drop in prices. Perception and feelings have always been a part of the capital markets so this wouldn’t be the first time that human emotion overtook a market sector.
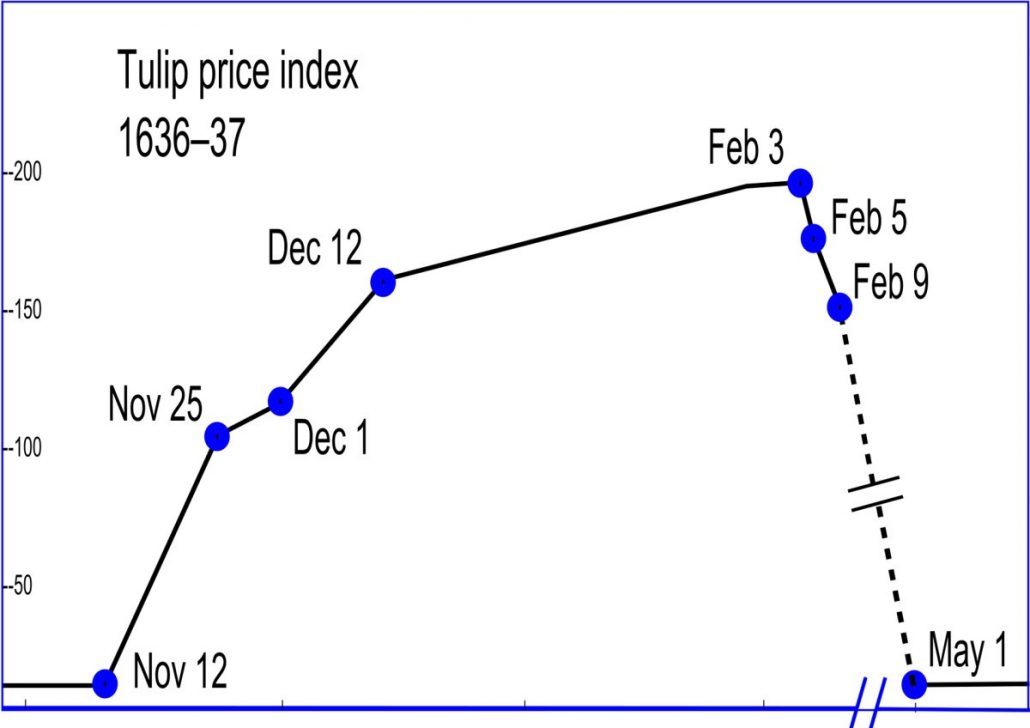
The Dutch Tulip Mania in late 1636 and early 1637 saw a spike in the price of tulip bulbs which was followed by a sharp plunge. The chart below reflects the price action.[i] Tulips had no economic value beyond the aesthetic qualities and the prices were set by what the buyers and sellers agreed upon. It’s a classic example of an emotional financial bubble.
This is not a prediction that the prices of crypto currencies mimic tulips bulbs in the 17th century. Bitcoin and the others probably have legitimate roles but there are many unanswered questions about their valuation. The volatility of the crypto prices indicates a lot of emotional buyers and sellers which may continue until their economic use and value become better defined.
While Bitcoin and Ethereum are current examples of sentiment driven markets, a case can be made that the entire financial system is one big pretense. The U.S. stock market is at all-time high levels and the S&P 500 has made 8 new record closes in April. At the same time, the U.S. has over $27 trillion of debt and over $120 trillion of debt and unfunded budget liabilities. And there is no plan to address this. Any credit analyst or auditor who looked at the U.S. financial statement would easily conclude we are bankrupt.
Below is a chart of the amount of U.S. Federal debt as a percentage of GDP.[ii] It shows that we are approaching the record levels from the end of World War II and the forecast is not good. Over the next 30 years, the CBO expects our level of debt as a percentage of GDP to double. This is a sad gift we are leaving to our children and grandchildren. Perhaps this is contributing to the rush to crypto currencies and other financial alternatives.
Despite the U.S. fiscal condition being an embarrassing disaster, the capital markets continue to function. Explaining this is on the same level as understanding the fundamentals of the Bitcoin. Perhaps there is a link between the two. Traders have a large amount of emotion in the form of confidence that the Federal Reserve keeps the liquidity at a level that keeps the system operating.
This charade can keep going indefinitely. Afterall, this financial insolvency didn’t happen overnight, and stocks and bonds have overlooked this situation for years. One of the chief reasons is that the U.S. dollar is the world’s reserve currency. This means that everyone needs dollars to execute international transactions. This further means that dollars held by international organizations and governments often get recycled back to the U.S. in the form of U.S. Treasury securities purchases. This helps the entire U.S. fixed income market which helps other asset classes including stocks. As long as the U.S. dollar is used for international trade, it helps boost confidence which allows the financial theater to persist.
Of course, there are countless catalysts that could upset this complacent landscape. If a highly leveraged hedge fund or financial institution becomes impaired, it could be disruptive. If foreigners’ reliance on the dollar declines, it will have a negative ripple effect. If the markets and foreign investors stop buying the debt that federal government is relying on to fund the deficits, it would be a tumultuous twist. This would likely cause a sizable increase in interest rates which would be a problem to an overleveraged system. Finally, other troubles could be a sustainable rise in inflation or if geo-political issues erupt.
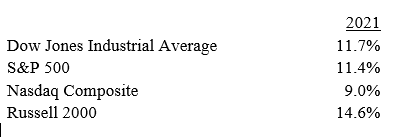
While these matters remain part of the financial equation, Mr. Market continues to view the glass as half full. The start of 1st quarter earnings reports has been encouraging. Also, the economic data is expected to further strengthen as more areas reopen. This has the potential to be a huge systemic tailwind. In anticipation, the Dow Jones Industrial Average and S&P 500 closed last week at record levels. Here is the year-to-date performance for the major averages as of April 16.
Stocks have had a good year which is historically a positive. In years when the 1st quarter is up, the remainder of the year typically builds on those gains. Of course, one can make the argument that this is anything but normal and the markets are facing a different set of risks. It would be irresponsible to blindly rely on historic trends in 2021. If the recent past has taught us anything, there is no such thing as normal.
However, there are a few things that we can be assured of as the year continues. We will continue to be pounded by the information tidal wave. The bombardment of news and data is something we will have to learn to manage. Otherwise, you might miss out on a critical, market moving statement by Fed Chairman Powell on interest rates. Or more importantly, you wouldn’t risk overlooking the latest Bitcoin prediction from Kim Kardashian or a NFT by Meghan Markle.
[i] https://www.history.com/news/tulip-mania-financial-crash-holland
[ii] CBO and Hedgeye Risk Management
“It’s Just Another Manic Monday. I Wish it was Sunday”
/0 Comments/in Financial Planning News /by jkerr“If Inflation Continues to Soar, You’re Going to Have to Work Like a Dog Just to Live Like One”
/0 Comments/in Financial Planning News /by jkerrKerr Financial Group
Kildare Asset Mgt.
Jeffrey J. Kerr, CFA
Newsletter
July 19, 2021 – DJIA = 34,687 – S&P 500 = 4,327– Nasdaq = 14,427
“If Inflation Continues to Soar, You’re Going to Have to Work Like a Dog Just to Live Like One”[i]
Inflation has been an important story of 2021. However, in a year full of historic news, higher prices seem more of an annoyance than a top of the fold story. To be sure, agitation sets in whenever someone stops at the pump, shops for groceries, or picks up the happy hour tab (thankfully there are happy hours again).
Yet, inflation gets swept under the rug in a world where the media pushes covid and climate change. In addition to journalistic suppression, the Federal Reserve, after years of calling for inflation, now refers to it as transitory. Even the most gullible should immediately question a bureaucracy who hasn’t gotten much right in the 100 years of its existence.
Inflation has been a part of mankind’s economic landscape from the beginning. In the past 50 years it has moved from the evil villain of the 1970’s to an ally to an over leveraged system. Since the 2008 – 09 crisis, our financial mandarins have spent a lot of energy trying to convince us that a little inflation is the solution to our economic woes. Be careful what you wish, you just might get it.
June’s consumer price index (CPI) report showed a 0.9% increase compared to May and a 5.4% year-over-year increase. May’s data showed similar increases in both the monthly and annual comparisons. Governmental talking heads insist that this is transitory, but it is starting to look more like a trend.
Looking closer at the CPI figures, used cars were up 45.2% year over year. Gasoline was up 45.1% and airfares up 24.6% over the same period. Here are some year-to-date commodity prices: natural gas is up 44.7%, crude oil up 48%, and coffee is up over 60%. Even coal, a commodity that most would expect to have gone the way of the dinosaur, is up 64% during 2021.
Despite what the Fed and bureaucrats tell us, inflation is not an economic benefit. One exception is that borrowers and those in debt have the advantage of paying their lenders in cheaper dollars. Other than debtors, inflation is a tax on the financial system and the impact is not evenly distributed across society.
Naturally the “Haves” can handle inflation much better than the “Have Nots”. Higher food and gas prices are an aggravation to the wealthy and the elites. It doesn’t have a material impact on their lives. In contrast, for the middle- and lower-income portions of the system, inflation becomes a big complication.
If inflation turns into a trend rather than being transitory, it accelerates the move toward feudalism that began last year. It is becoming more and more difficult to climb the social ladder. The government is paying citizens to not work, closing small businesses to the benefit of big business, and canceling those who disagree. Longer term inflation will further widen the gap between the elites and 1%’ers and the rest of our country.
Here is the year-to-date performance for the major averages as of April 16.
Inflation naturally has a big impact on the capital markets. Typically, bonds underperform and some stock market sectors struggle. This is especially the case where industries are unable to pass along price increases. If inflation drags down economic growth and stagflation becomes dominant, everything suffers. We are approaching some critical points that may have enormous impacts on the direction of the markets. It could be a very tumultuous period. Call or email me for further details.
[i] George Gobel
The Army of the Apes takes on Wall Street
/0 Comments/in Financial Planning News /by jkerrMan Vs. Computers – Who Wins in the Financial Markets?
/0 Comments/in Financial Planning News /by jkerrSpring time on Wall Street – “Sell in May and Go Away”
/0 Comments/in Financial Planning News /by jkerrCopy of the 1st Quarter Review Letter
/0 Comments/in Financial Planning News /by jkerrKERR FINANCIAL GROUP
KILDARE ASSET MANAGEMENT
45 Lewis Street, Lackawanna RR Station
Binghamton, NY 13901
Phone: 607-231-6330 email: [email protected]
The following is a copy of the 2021 1st quarter letter sent to clients. It reviews the markets and the client account’s activity and performance for the 1st quarter of 2021.
April 30, 2021
When investors consider the bond market, it is often within a strategy of safety. This is because fixed income securities historically have had less volatility and come with periodic interest payments. These qualities typically attract conservative, income seeking investors which has contributed to a view that bonds are safe and rarely lose money. As 2021’s 1st quarter has shown, this is not the case.
On the surface, fixed income securities are pretty simple. They are a loan that the bond buyer gives to the issuing company, organization, municipality, or government in exchange for interest payments and, hopefully, a return of the money at the bond’s maturity. Like many things, there are numerous variables below the surface.
Bonds have two main risks – credit and interest rate. Credit risks are centered on the financial strength of the issuing entity. In other words, it is the risk that bond holders get their capital back at maturity. This risk is minimal on U.S. Treasury notes and bonds as the belief is that the Federal government can raise taxes or print the money to repay the bonds. Logically, credit risk is much higher for a small speculative company in a competitive industry.
Interest rate risk applies to all fixed income instruments and it is the risk that interest rates move higher while holding the bond. An explanation of a bond would be helpful. Bonds usually are issued in $1,000 increments and have a fixed interest rate. For example, ABC Company, who is a stable industry leader, sells bonds with a 20-year maturity and a 4% interest rate. This means that the buyer receives $40 per year per bond (4% X $1,000). Most U.S. bonds make their interest payments every 6months. For the ABC example, this would be $20 payments twice a year.
Trouble arises if interest rates increase because it makes existing bonds less attractive. Our ABC bond’s interest rate is fixed at 4%. If interest rates rise (for whatever reason), investors would prefer the newer and higher yield vs. our 4% rate. Within this environment, let’s assume the new market level for an issuer such as ABC might move to 4.5%. Who wants 4% when they can get 4.5%? The bond market makes the adjustment by reducing the price of the 4% debt to a point where the $40 dollars of interest equals 4.5%.
The market adjusts the ABC bond’s price to account for this shortfall. Here is the math; $40/X = $45/$1,000. “X” equals $888.88 and this becomes the new, reduced price of the ABC bond which was originally priced at $1,000. The $40 in annual interest payments divided by new price of $888.88 equals 4.5%. The holders of the ABC bond have experienced a drop in the price of their bond.
Holders of the ABC 20-year 4% issue have a couple of decisions. They can sell it and incur a loss. The investor can hold it and hope interest rates fall (the bond price would move back toward $1,000). They can even hold the bond to maturity at which time the investor will receive the $1,000 of principle.
Of course, the result would be different if interest rates declined. In this case, the price of our pretend ABC bond would increase, and the position would be positive. If the market interest rate for this type of bond fell to 3.5%, the price of the bond would increase to $1,142.85 ($40/$1,143.85 = 3.5%). Obviously, the direction of interest rates has a big influence on the price and performance of fixed income investments.
Rising interest rates were a big part of the financial market landscape in the 1st quarter. The 10-year U.S. Treasury note began the year with a yield of 0.9% and ended the quarter at 1.7%. Consequently, a lot of fixed income securities took haircuts with the longer maturities getting hit the hardest.
One of the most widely held ETFs is the iShares Treasury Bond Fund (symbol =TLT). The TLT tries to track an index of U.S. Treasury bonds with maturities 20 years and more so it is a good barometer for the long maturing bonds. Many consider this a good conservative holding that pays an interest rate. Because interest rates rose, TLT lost 14.1% in the first quarter which was one of the worst starts to a year ever. The ETF’s dividend return is around 1.6% which means that it lost 8 ¾ years of annual interest payments in 3 months. This is a huge loss for something that is expected to provide stability.
The carnage was across the fixed income market. Looking at some other sectors, the iShares Investment Grade Bond ETF (symbol = LQD) is made up of high-quality corporate bonds. It fell 5.8% in the first quarter. Finally, the Barclay’s U.S Aggregate Index (a wide-reaching index that includes treasuries, municipals, corporate, and government agency bonds. It is like the Dow Jones Industrial Average for the bond market) was down 3.4%.
The bond market’s carnage is one of the best kept secrets of 2021’s 1st quarter. Of course, the first three months of the year provided much headline competition. We had the GameStop/Reddit/Robinhood theater, the invasion of the SPACs, a hedge fund failure (Archegos), a surge in crypto currencies, and record levels in the stock market.
It’s little wonder that the bond market’s bloodbath got pushed to the back pages. However, this pain might get more attention as investors are disappointed by quarterly mutual fund statements. Mutual funds that have fixed income exposure, as well as “blended”, “balanced” and “target date” funds were challenged by interest rates and underperformed.
In contrast, the stock market had a good 1st quarter. The major indexes steadily moved from lower left to upper right logging a series of record highs. A curious development was that technology and growth sectors underperformed. Financials(higher interest rates help), energy, industrials, and areas that will benefit from an economic reopening led equities. Small caps were stronger than the large caps.
Here are the performance numbers for the major averages.
Here’s the performance for the 1st quarter 2021 for our clients averaged and weighted against the total:
Within the portfolio holdings, American Outdoor Brands (symbol = AOUT) reported strong numbers and the stock moved higher. AOUT makes products and accessories for hunting, fishing, camping, and other outdoor activities. The company was spun out of Smith & Wesson in 2020.
AOUT navigated 2020’s economic problems well and took advantage of growing interest in outdoor recreation. The company is projected to generate around $270 million of sales in their first fiscal year as a stand-alone company. This will be an increase of over 50% from the prior year. Their net income for the 9 months ending January 31, 2021 was $1.20 per share which was an improvement from a loss in the prior year.
The American Outdoor Brands’ stock price moved from $17 per share at the beginning of the year to over $25 at the end of March. Importantly, the company has successfully brought new products to the market. Management believes they can continue to drive growth through expanding their market share as well as exciting new products.
Looking forward at the financial markets, they will wrestle with many crosscurrents in the remaining part of 2021. The economy will re-open but it could be an uneven process. Inflation has returned and this has potential to be a big problem. Interest rates will likely continue to climb which is something that has not happened in almost40 years. Recent government proposals are historic in size and reach. If enacted, it will dramatically change the U.S. economic system.
As always, these situations present both risks and opportunities. It could easily result in new and different economic leaders as initiatives change the way industries and businesses operate. I will work hard to keep up with these developments and identify the prospects that will lead to continued success.
Please feel free to call with any questions. Thank you for your business and continued confidence placed in me.
Sincerely,
Jeffrey J. Kerr, CFA
“Art for Art’s Sake” – April Newsletter
/0 Comments/in Financial Planning News /by jkerrKerr Financial Group
Kildare Asset Mgt.
Jeffrey J. Kerr, CFA
Newsletter
April 19, 2021 – DJIA = 34,200 – S&P 500 = 4,185– Nasdaq = 14,052
“Art for Art’s Sake”
With all of the ways that we communicate combined with the speed that it is delivered, it should be easy to keep up with everything. We have cell phones, email, text messages, social media, phone apps, and hundreds of radio and cable channels. Unfortunately, having countless ways to stay connected doesn’t equate with being informed. It often feels like we are using smoke signals while the rest of the world is telepathically in sync.
This brain bruising overload happens in all parts of our lives – news, fashion, music, sports, and, of course, the financial markets. Within recent years investors have had to deal with a flood of new things like SPACs, crypto currencies, blockchain, and NFTs. These are new and complex products and it makes some traders yearn for the simpler days that included such things as physical trading floors and handwritten orders.
For those who might be off the grid, SPACs are Special Purpose Acquisition Companies. They raise money to buy another company which is typically private which becomes an alternative method for an IPO (initial public offering). SPACs have grown in popularity and have raised a lot of money. With all this money comes risk as there is a finite number of strong buy out candidates waiting to run into the arms of a SPAC. This means that there are plenty of bad deals are being done.
Crypto currencies are digital currencies that are not controlled by any central authority. There are many versions of cryptos but Bitcoin and Ethereum are the most popular and have generated the most excitement. Blockchain is part of the crypto currency universe. It is an open ledger which is monitored and reviewed by a network of computers. Wall Street is developing strategies involving crypto currencies and related assets.
NFTs are non-fungible tokens which are a unit of data stored on a digital ledger (blockchain). NFTs are growing in the digital collectable markets and they offer a level of authenticity. NFTs do not include the copyright so duplicates can be available to anyone. NFTs can be bought and sold with all transactions being recorded on the blockchain.
NFTs have gained notoriety when Christie’s auction house recently sold a digital collage of 5,000 images for $69.3 million dollars. The image is at the top of this newsletter and the piece is entitled “Everydays: The First 5000 Days”.
These controversial financial products are difficult to understand and, perhaps, harder to analyze. SPACs indirectly fit into conventional analysis. They have a cash value prior to acquiring a company and, after the ‘de-spac’, shareholders have ownership of a company. At this point, the security is a claim on the assets, revenues, earnings, and cash flows which can be valued.
There are deep debates about how to view and evaluate cryptos and NFTs. Believers argue these are alternatives to the U.S. dollar and will ultimately become the economy’s currency. Digital bulls point out that the dollar has been under attack from the Federal Reserve and the Federal Government and has lost over 90% of its value in the last 100 years. They say the time has come for a replacement.
Crypto skeptics contend that Bitcoin, Ethereum, et. Al. will not be able to gather enough confidence to become a method of exchange. Without acceptance, it is difficult to become a store of value which is a characteristic of currencies. Many detractors believe cryptos will turn into a commodity.
Blockchain has potential to transform our lives. It has the capability to offer lower cost, transparent, and accurate record keeping. This digital data base could change the way we perform financial and legal transactions in the future. As crypto currencies are linked with blockchains, they are expected to have a role in the financial landscape.
With these possibilities in mind, bystanders could be bewildered by the price of Bitcoin and the rest of the crypto currencies. For those not following, Bitcoin’s price has moved from $10,000 last summer to over $60,000 last week. Ethereum has climbed from below $200 to over $2,500 during the same period.
In addition to all the fundamental twists and turns during the past 10 months, a fair amount of emotion has helped drive crypto prices. Crypto believers have deep faith in the future applicability and value of Bitcoin. It seems like the only thing that will dent their enthusiasm is a drop in prices. Perception and feelings have always been a part of the capital markets so this wouldn’t be the first time that human emotion overtook a market sector.
The Dutch Tulip Mania in late 1636 and early 1637 saw a spike in the price of tulip bulbs which was followed by a sharp plunge. The chart below reflects the price action.[i] Tulips had no economic value beyond the aesthetic qualities and the prices were set by what the buyers and sellers agreed upon. It’s a classic example of an emotional financial bubble.
This is not a prediction that the prices of crypto currencies mimic tulips bulbs in the 17th century. Bitcoin and the others probably have legitimate roles but there are many unanswered questions about their valuation. The volatility of the crypto prices indicates a lot of emotional buyers and sellers which may continue until their economic use and value become better defined.
While Bitcoin and Ethereum are current examples of sentiment driven markets, a case can be made that the entire financial system is one big pretense. The U.S. stock market is at all-time high levels and the S&P 500 has made 8 new record closes in April. At the same time, the U.S. has over $27 trillion of debt and over $120 trillion of debt and unfunded budget liabilities. And there is no plan to address this. Any credit analyst or auditor who looked at the U.S. financial statement would easily conclude we are bankrupt.
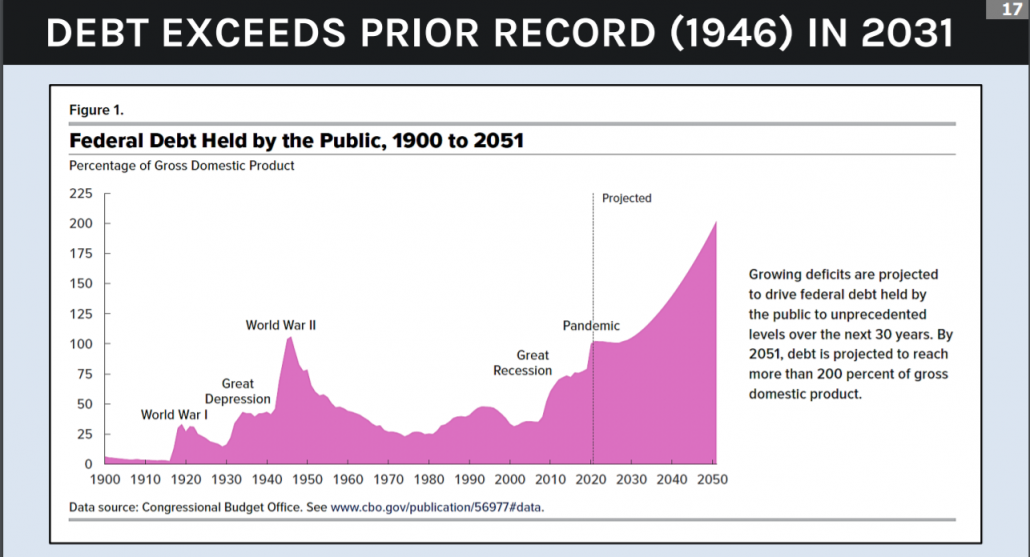
Below is a chart of the amount of U.S. Federal debt as a percentage of GDP.[ii] It shows that we are approaching the record levels from the end of World War II and the forecast is not good. Over the next 30 years, the CBO expects our level of debt as a percentage of GDP to double. This is a sad gift we are leaving to our children and grandchildren. Perhaps this is contributing to the rush to crypto currencies and other financial alternatives.
Despite the U.S. fiscal condition being an embarrassing disaster, the capital markets continue to function. Explaining this is on the same level as understanding the fundamentals of the Bitcoin. Perhaps there is a link between the two. Traders have a large amount of emotion in the form of confidence that the Federal Reserve keeps the liquidity at a level that keeps the system operating.
This charade can keep going indefinitely. Afterall, this financial insolvency didn’t happen overnight, and stocks and bonds have overlooked this situation for years. One of the chief reasons is that the U.S. dollar is the world’s reserve currency. This means that everyone needs dollars to execute international transactions. This further means that dollars held by international organizations and governments often get recycled back to the U.S. in the form of U.S. Treasury securities purchases. This helps the entire U.S. fixed income market which helps other asset classes including stocks. As long as the U.S. dollar is used for international trade, it helps boost confidence which allows the financial theater to persist.
Of course, there are countless catalysts that could upset this complacent landscape. If a highly leveraged hedge fund or financial institution becomes impaired, it could be disruptive. If foreigners’ reliance on the dollar declines, it will have a negative ripple effect. If the markets and foreign investors stop buying the debt that federal government is relying on to fund the deficits, it would be a tumultuous twist. This would likely cause a sizable increase in interest rates which would be a problem to an overleveraged system. Finally, other troubles could be a sustainable rise in inflation or if geo-political issues erupt.
While these matters remain part of the financial equation, Mr. Market continues to view the glass as half full. The start of 1st quarter earnings reports has been encouraging. Also, the economic data is expected to further strengthen as more areas reopen. This has the potential to be a huge systemic tailwind. In anticipation, the Dow Jones Industrial Average and S&P 500 closed last week at record levels. Here is the year-to-date performance for the major averages as of April 16.
Stocks have had a good year which is historically a positive. In years when the 1st quarter is up, the remainder of the year typically builds on those gains. Of course, one can make the argument that this is anything but normal and the markets are facing a different set of risks. It would be irresponsible to blindly rely on historic trends in 2021. If the recent past has taught us anything, there is no such thing as normal.
However, there are a few things that we can be assured of as the year continues. We will continue to be pounded by the information tidal wave. The bombardment of news and data is something we will have to learn to manage. Otherwise, you might miss out on a critical, market moving statement by Fed Chairman Powell on interest rates. Or more importantly, you wouldn’t risk overlooking the latest Bitcoin prediction from Kim Kardashian or a NFT by Meghan Markle.
[i] https://www.history.com/news/tulip-mania-financial-crash-holland
[ii] CBO and Hedgeye Risk Management
Copy of the 4th Quarter Review Letter
/0 Comments/in Financial Planning News /by jkerrKERR FINANCIAL GROUP
KILDARE ASSET MANAGEMENT
45 Lewis Street, Lackawanna RR Station
Binghamton, NY 13901
Phone: 607-231-6330 email: [email protected]
The following is a copy of the 2020 4th quarter letter sent to clients. It reviews the markets and the client account’s activity and performance for the 4th quarter of 2020.
The volume of books and articles that will be written about 2020 will reach to the boundaries of our universe. Any time span that includes a presidential impeachment, a global pandemic, an economic shutdown, a disputed presidential election, and vast social divide is a good candidate for a defining and historic year.
Of course, given these events, the economy and capital markets also experienced a historic year. We had record high unemployment, a record contraction in economic activity, record low interest rates, and, after a broad painful stock market selloff, a recovery to record levels.
Looking at some of these financial market details, the U.S. unemployment rate reached 14.8% in April and remained above 10% until September. Government bond yields plunged to incomprehensible levels as the 10-year note fell below 40 basis points (0.40%) and the 30-year bond sank to 83 basis points (0.83%).
Think about that – bond buyers were lending money to the U.S. government at less than 1/2% for 10 years and less than 1% for 30 years! For those who have bond mutual funds in a retirement account or a target date mutual fund, you were part of the lending posse lining up to buy these bonds at ridiculous prices.
The major stock market indexes fell over 30% from February’s peak to March’s trough. The Russell 2000 was down over 40% in the same period. The Russell is a broader reaching benchmark that is made up of small cap stocks and, in many cases, is more representative of the average stock.
It was unclear, at the time, what was going to happen. The economy was being closed and no one knew for how long and to what extent. Further, there were estimates that the virus would claim millions of lives. Uncertainty ruled the day.
The equity market’s rebound began as a function of government programs to stabilize the economy. The Federal Reserve announced astounding sized bond buying programs to inject liquidity into the financial system. Our central bank’s balance sheet spiked from $4.1 trillion to $7.4 trillion or an 80% increase during the year. This means that within a few months our Treasury Department printed a mindboggling $3 trillion and then turned it over to the Fed. The Fed went into the markets and bought all kinds of bonds.
The financial markets quickly regained confidence as they understood that the government was going to use all possible options and use them in an enormous scale. The result was that the Nasdaq Composite recaptured its losses by June. It took until August for the S&P 500 to recover and November for the Dow Jones Industrial Average and the Russell 2000.
From the view point that Washington was back stopping everything, the stock market’s steady climb made sense. However, looking through the lens that showed burning cities, an economy that was shut down, and an upcoming election, it was inexplicable. Viewing this conundrum without seeking a logical narrative provides a possible answer.
Quantitative analysis and trading are playing a big role across the financial markets. This approach is driven by hundreds of computer algorithms and programs. The software scans the markets looking to capitalize on patterns or outlier events. Although some do include headline keywords and other news influences, the variables usually look at things such price action, volume, volatility, and standard deviations. They watch how differing asset classes trade relative to each other. For example, the U.S dollar in the foreign exchange market vs. the S&P 500 or the 10-year Treasury note vs the price of crude oil. These seemingly unrelated markets can influence each other, and the quantitative models attempt to discover trends.
Importantly, these relationships and their derivatives normally have nothing to do with fundamental and real-world developments. Computer algorithms typically don’t care who won an election or about a switch in monetary policy. These types of events will likely work their way into factors of price or the standard deviation of a security, but it may take some time. In the meantime, the trend that the quants are following remains intact and that is what determines the trading.
The use of quantitative trading has grown, and I think it is a big reason that the Dow can trade above 30,000 while the economy and small businesses are being crushed. Of course, the reverse can be true as markets can be tumultuous despite rosy headlines.
The stock market closed 2020 at record levels which contrasted with the year’s challenges. The Nasdaq lead the way and the indexes had very good years. Here are the 4th quarter and full year performance numbers.
In addition to stocks, bonds performed well as the Barclay’s Aggregate Index (a composite of many sectors of the fixed income market) had a 7.5% total return. Gold climbed 24.6% in 2020. In general, commodities were higher during the year except for oil. Crude oil fell to the single digits during the initial shutdown and recovered later in 2020 but was down around 20% for the twelve months. The U.S. dollar fell against the other major currencies and the dollar index declined 6.7% in 2020.
I spent time throughout 2020 learning and trying to better understand the quantitative approach. This included reading several books on the topic as well as adding a subscription to a math-based investment approach. The combined influences helped your performance.
One example of a quantitative assisted decision relates to Cerence, Inc. (symbol = CRNC). The company develops voice recognition software for the automobile industry. The 3rd quarter review letter contains more details on the company. CRNC was a strong performer in 2020 and it doubled in the 4th quarter jumping from $50 to $100 per share.
On a purely fundamental basis the stock was overpriced in the $50’s but from a quantitative view, the trend was up, and the company is growing quickly. In many cases, algorithms focus on relative performance (are things improving or deteriorating) more than absolute performance (traditional fundamental valuation). From this perspective, we held the stock and were rewarded.
Another holding that was included from a computer algorithmic basis was MP Materials (MP). This was purchased in November in the low teens and it closed the year in the $30’s. MP is a rare earth mining company that came public via a SPAC (special purpose acquisition company). SPAC’s are organizations that raise money with the goal of buying an operating business. They are a growing part of the stock market and MP is one example.
Returning to the old fashion fundamental research approach, Popular, Inc. (BPOP) also drove 4th quarter performance. Popular is the largest bank in Puerto Rico. There is limited competition as many of the U.S. banks have left the island. This is understandable given the challenges to the Puerto Rican economy. Natural disasters, a population exodus, and slowing business activity have hurt.
As mentioned, Popular has a dominate position on the island. When it was purchased for your account, the company was solidly profitable, and the stock was trading at half of its book value. Our entry price offered a 4% dividend yield. BPOP’s stock price moved from the mid-$30’s to the mid $50’s during the 4th quarter. Despite this move, the stock remains cheaply valued.
The capital markets overcame the country’s and the world’s struggles. While they recovered and performed well, many of the issues are unresolved. The events from last year will impact our world for many years and they will produce opportunities as well as new risks. I will look to balance these conflicting forces to help you grow your assets.
Sincerely,
Jeffrey J. Kerr, CFA
“And I Feel Like I’ve Been Here Before” – March Newsletter
/0 Comments/in Financial Planning News /by jkerrKerr Financial Group
Kildare Asset Mgt.
Jeffrey J. Kerr, CFA
Newsletter
March 1, 2021 – DJIA = 30,932 – S&P 500 = 3,811– Nasdaq = 13,192
“And I Feel Like I’ve Been Here Before”
As much as everyone looked forward to hitting the delete button on last year, the extensive optimism over the new year might be in for a test. Sadly, the first two months of 2021 look like they belong to 2020. To be sure, there is plenty of time left in the year to overcome our country’s challenges and return to some version a normal society. But the direction of current events is deteriorating rather than improving.
In addition to the news not improving, it looks like it’s been recycled from 2020. As you recall, last year began with a presidential impeachment. 2021 also began with a presidential impeachment. In late January 2020, President Trump was acquitted. He was acquitted this January as well.
The virus hit the U.S. in the first quarter of 2020. The country was shut down and the focus for the remainder of the year was battling the pandemic. This introduced the concepts of ‘Social distancing’, wearing masks, and working from home. In 2021, there are concerns over variants of the virus which could delay re-opening the economy as well as bring new challenges.
In February 2020, the stock market moved to record highs. Similarly, stocks traded to all-time high levels in February 2021. Of course, last year the capital markets panicked as the economy shutdown. Stocks plunged and the bond market froze on the unknowns over the severity of the virus’s impact on the population and the length of time that the economy would be shutdown.
The U.S. dollar rose against other currencies as it was viewed as a safe haven. The commodity markets plunged because closed economies have very little industrial demand. Crude oil futures traded at negative prices. This meant that the buyer of the futures contract got the oil and got paid to take it. In 2021, let’s hope this is a case of déjà vu instead of an actual repeat of last year’s disruptive events.
The first two months of this year have had some events that smelled like 2020 but were very unique to 2021. The Reddit/Robinhood/GameStop saga is something not seen before. A few weeks ago, this was the lead story on every news outlet including the non-business/financial channels. Strangely it has gotten very coverage after the “meme stocks” settled down.
The fact that journalists have moved on from the Redditt rebels does not mean that the risks have receded. This episode exposed some structural issues that have developed within the markets’ plumbing.
One of the strategies of the Robinhoodies was buying heavily shorted stocks. Hedge fund, institutions, and large investors had made massive bets against certain companies. When the Robinhoodies started buying these stocks their prices spiked higher. This resulted in big losses for the hedge fund crowd. As the losses escalated, the negative bets were forced to be unwound which meant more buying and even higher prices and larger losses. It became a violent cycle causing widespread pain.
During these events, many market blemishes were uncovered. It was known that many traders and hedge funds were using leverage to boost returns and measurements of systemwide borrowings have been near record levels. What was not as understood was that the leverage was on top of very concentrated portfolios with limited diversification.
Leverage wasn’t the only Reddit revelation. We learned that these market players were buying the same stocks. This institutional overlap and concentration isn’t a problem until the positions start losing money and the markets turn into a huge game of musical chairs.
These risks could ultimately become systemic. If an overleveraged player becomes impaired and are forced to raise cash, they will likely have to sell the positions that are heavily owned by others. This could cause other firms to suffer losses and make them sell which then forces the pain to ripple throughout the markets.
It is possible that these risks might be contained through hedging strategies. It is difficult to determine the systemwide summation of risk reducing hedging, but it is possible that it could be an answer. Another solution is that hedge funds and investment firms reduce leverage and concentration over time. Given the history of hedge fund trading, that is not an expected development.
While systemic risks exist, the markets continue to trade as if the party is nowhere near an end. The stock market indexes are up in 2021 but the leadership has shifted from large cap tech to energy and small cap stocks. Here is the performance of the major indexes for the first two months of the year.
The stock market rally could continue as the economy reopens and unemployment declines. The year-over-year comparisons will be
financial market supportive as 2020’s 2nd quarter numbers were among the worst in history. Also, judging pent up consumer demand for travel and entertainment is tricky but this could support even stronger GDP growth later in 2021.
The déjà vu from other parts of the markets did not spread to the fixed income market. In 2020 bond yields declined. First, yields fell as the collapse in economic activity crushed any demand for loans. Secondly, the Federal Reserve bought billions of dollars of bonds as a way of supporting the markets and the economy. This forced interest rates lower. The 10-year Treasury bond’s yield traded below 40 basis points (0.40%) last year.
It’s been a different story in 2021. The 10-year Treasury bond began the year around 90 basis points (0.90%) but closed last week at 1.46%. This may not seem like a significant move but on a relative basis it is an over 50% move in 2 months. Also, the 10-year bond is a critical, far reaching security in the fixed income market as many other products (mortgages, corporate bonds, etc.) get priced off the Treasury market. The 10-year’s higher yield will cause higher interest rates throughout the markets.
This rise in longer term interest rates is typically a result of economic growth or inflation expectations. The bad news for 2021 is that inflation worries are behind this increase in interest rates. Crude oil and commodities prices have climbed in recent months as suppliers and miners have kept operations at reduced levels. If inflation is the reason for this development, it becomes another risk to the stock market and is likely the reason for the tech stocks’ recent weakness.
The end of 2020 brought anticipation of a new and more pleasant time. Unfortunately, that hasn’t been the case. Some of the disappointment is an extension of last year’s developments. New issues have popped up in 2021 which have helped spread the cultural angst. Instead of suffering further déjà vu of 2020, hopefully we will be experiencing new and enjoyable events.
[i] David Crosby, 1970
Copy of the 3rd Quarter Review Letter
/0 Comments/in Financial Planning News /by jkerrKERR FINANCIAL GROUP
KILDARE ASSET MANAGEMENT
45 Lewis Street, Lackawanna RR Station
Binghamton, NY 13901
Phone: 607-231-6330 email: [email protected]
The following is a copy of the 2020 3rd quarter letter sent to clients. It reviews the markets and the client account’s activity and performance for the 3rd quarter of 2020.
There was a time when all stock trades were done on a floor of an exchange that had a physical location. The New York Stock Exchange was the most famous but there were additional regional exchanges that included the American Exchange (also in New York), the Boston Exchange, and the Philadelphia Exchange. Specialists and floor brokers were the men and women at these locations who handled the trades.
The world has changed so naturally the mechanics of trading stocks have also changed. Computers handle most of the today’s transactions as floor brokers are as relevant as a phone book. As progress has accelerated, computers have taken a larger role in finance. Now, in addition to handling transactions, computers are widely used in research and investment decisions.
Financial markets used to seek out and reward successful companies that had growing sales and profits. Things have changed and the correlation between strong financials and a rising stock price has decreased. Math based algorithms look at a much different set of factors to make decisions which reward not so successful companies (as measured by traditional methods).
Computer programs and algorithms scan oceans of data within seconds looking for price patterns or anomalies that offer trade setups. These algos are driven by sophisticated mathematical formulas. Unlike traditional investment research which focuses on financial statements and economic conditions, computers utilize calculus and statistics as they concentrate on such things as price action, volatility, and correlations between asset classes.
This high-tech approach has changed the investment decision making process. Algorithmic trading tends to be more frequent and have short holding periods. It doesn’t rely on price-earning (P/E) ratios, book values, or dividend yields. Instead, sales growth rates and relative movements (are things getting better or worse) are the focus. Further, the rates of change of the indicators such as revenues and EBITDA is an important driver of the computer programs. This can lead to stocks with upward price momentum becoming be a market leader even if its financial condition is weak.
This new landscape can be maddening as stocks that appear to have challenges and outsized risks surprisingly become market leaders. As an example of this new landscape, “If you bought every company that lost money in 2019 that had a market cap of over $1 billion (of which there were about 261)…you’d be up 65% for far this year”. (This quote is from Grant’s Interest Rate Observer, October 30, 2020.)
Institutions, trading firms, and hedge funds devote big resources to algorithmic trading and it is responsible for a significant amount of daily trading activity. There is fierce competition to find the newest and most accurate program that provides an edge over others. Algorithms are important part of the capital market environment and will continue to play an important role.
Given the importance of computer programs, I have tried to implement some of these approaches into my decision making process. Many data providers now include a computerized ranking systems or similar type service offering recommendations. On their own, none of these are the Holy Grail. But, they become part of the equation and are helpful in determining such things as entry points and slowing price momentum.
As reported by The Wall Street Journal, more stocks have risen 400% or greater than any year since 2000. Given that stocks plunged at the end of the 1st quarter, these moves largely took place in the 2nd and 3rd quarters. The list of this year’s highfliers has many technology and biotech stocks. Many of these names are losing money or are marginally profitable but the rates of change for their sales and EBITDA are improving.
Beyond these shooting stars, the broader stock market had a good quarter. The indexes steadily rose during July and August but was down in September. Despite the upcoming election, the capital markets’ chief focus was on stimulus programs and the possibility of another economic shutdown. Here are the major averages’ performances for the 3rd quarter and year-to-date.
We had some positions that were helped by the algorithmic trading. Cerence Inc. (symbol – CRNC) is a developer of software and artificial intelligence products that does voice recognition for automobiles. They have relationships with every car maker throughout the world. Until 2019, they were a division of another voice recognition software developer (Nuance) but were spun out in the 3rd quarter of 2019.
Cerence generates over $300 million of annual revenues and is forecasting growth. The company has a history of working with auto manufacturers and is continuing to add features for new voice commands for the next generation of cars. Importantly, they are involved in the autonomous navigation developments.
CRNC’s stock began the year in the mid-teen’s. Since the markets’ lows in March, the stock has dramatically climbed. It recently has traded in the mid $60’s. At current levels, the stock is overvalued and could see a pullback if the market suffers a correction. However, Cerence is experiencing positive rates of change across many indicators and that might be enough to keep the algorithms happy.
New Fortress Energy is another example of a fast growing company with a surging stock price. NFE builds and operates LNG (liquefied natural gas) import terminals and facilities in smaller markets who need cheaper energy. Current operations are in Jamaica, Puerto Rico, Mexico, Nicaragua, Pennsylvania, and South Florida. New Fortress delivers LNG to these areas and converts it back to natural gas which is a lower cost energy source for the local economy.
NFE’s stock was in the low and mid teen’s as recently as June. It recently reached $52. While the company is young, New Fortress has been adding new operations and signing agreements for future projects. The current growth rate is high and the potential for further expansion looks bright.
Once again, NFE is an overpriced stock and it took a large dip at the end of October on their quarterly report. However, if business conditions are favorable and the company can execute on its growth plans, the stock price will recover and move to new highs.
There are many approaches to investing. Computerized trading and algorithms have become a large part of the landscape. This is a much different approach from the traditional research and portfolio construction methods. While there have been much development and success using these new techniques, they have not eliminated risks. Nevertheless, they offer additional pieces into the decision making process which will help spot future opportunities.