
“Professor Plum, With the Candlestick, in the Conservatory”

Kerr Financial Group
Kildare Asset Mgt.
Jeffrey J. Kerr, CFA
Newsletter
December 17, 2018 – DJIA = 24,100 – S&P 500 = 2,599 – Nasdaq = 6,910
“Professor Plum, With the Candlestick, in the Conservatory”
Before cable TV offered hundreds of stations, board games were a big part of family entertainment. While classic board games are still around and are occasionally played, they have become a nostalgic memory. And as our lives have changed, family time spent with a board game has turned into checking our social media accounts while watching reality TV.
One of the most popular board games is “Clue”. It is a murder mystery game that requires players to determine who committed the crime, in which room, and with which weapon. Those familiar with the game will remember colorful character names including Miss Scarlett, Mrs. Peacock, Colonel Mustard, and Professor Plum. The rooms included the conservatory, lounge, billiard room, study, and library. The candlestick, lead pipe, revolver and rope were some of the weapons used.
For those sentimental souls who have a yearning to play but don’t have a worn box of “Clue” in the storage closet, the financial markets might be an alternative. Instead of the game’s characters, we have President Trump, Jerome Powell, Theresa May, and President Xi. The weapons are interest rates, the U.S dollar, and tariffs. The locations are the New York Stock Exchange, the bond market and Washington DC. Let’s start the game.
There is plenty of mystery behind the recent economic and financial developments. The major stock market averages reached record levels in September but have fallen since. After an attempted bounce in early November the weakness returned later in the month and into December. Stocks are on pace for one of the worst 4th quarters in history.
The weakness in stocks can be shown by a couple of examples. The week of Thanksgiving is historically a strong period for the stock market but for just the second time since 1964 the Dow Jones Industrial Average fell all four trading days of that week. This out of character decline could be sending a message.
The week after Thanksgiving gave investor relief as stocks rallied. It was the best week in 7 years for the S&P 500 and Nasdaq Composite. Unfortunately, equities gave back all of these gains the following week (two weeks ago) as the Dow, S&P 500, and Nasdaq Composite all fell over 4% while the Russell 2000 dropped over 5%.
Last week a mid-week rally attempt failed miserably and the major averages closed at the lowest levels since February. There was real carnage in some other areas. The Dow Jones Transportation Average and Russell 2000 made new 52-week lows on Friday. The Transportation Average is down 18.1% from its record high in September while the Russell has fallen 19% from its record. On the bullish side, the Dow Jones Utility Average made a 52-week high this. Unfortunately, utility stocks are not considered a good leading sector.
Equities have endured a lot of selling during the past couple of months and some sort of bounce would be expected. But it is not good when we get it (last week of November – again best week in 7 years as well as the middle of last week) and then immediately give it back. Here is where the major averages are year-to-date as of last Friday’s close.
| 2018 | ||
| Dow Jones Industrial Average | -2.5% | |
| S&P 500 | -2.8% | |
| Nasdaq Composite | 0.1% | |
| Russell 2000 | -8.1% |
Another puzzling piece of the market puzzle is the bond market. Two aspects need discussion – the yield curve and the level of yields. The yield curve has recently been a major Wall Street topic. The yield curve is a graph which shows the yield or interest rate on a type of bond for various lengths of time (normally a few months out to 30 years). It shows the relationship between interest rates and time. Below is a recent yield curve for the U.S. Treasury debt market.
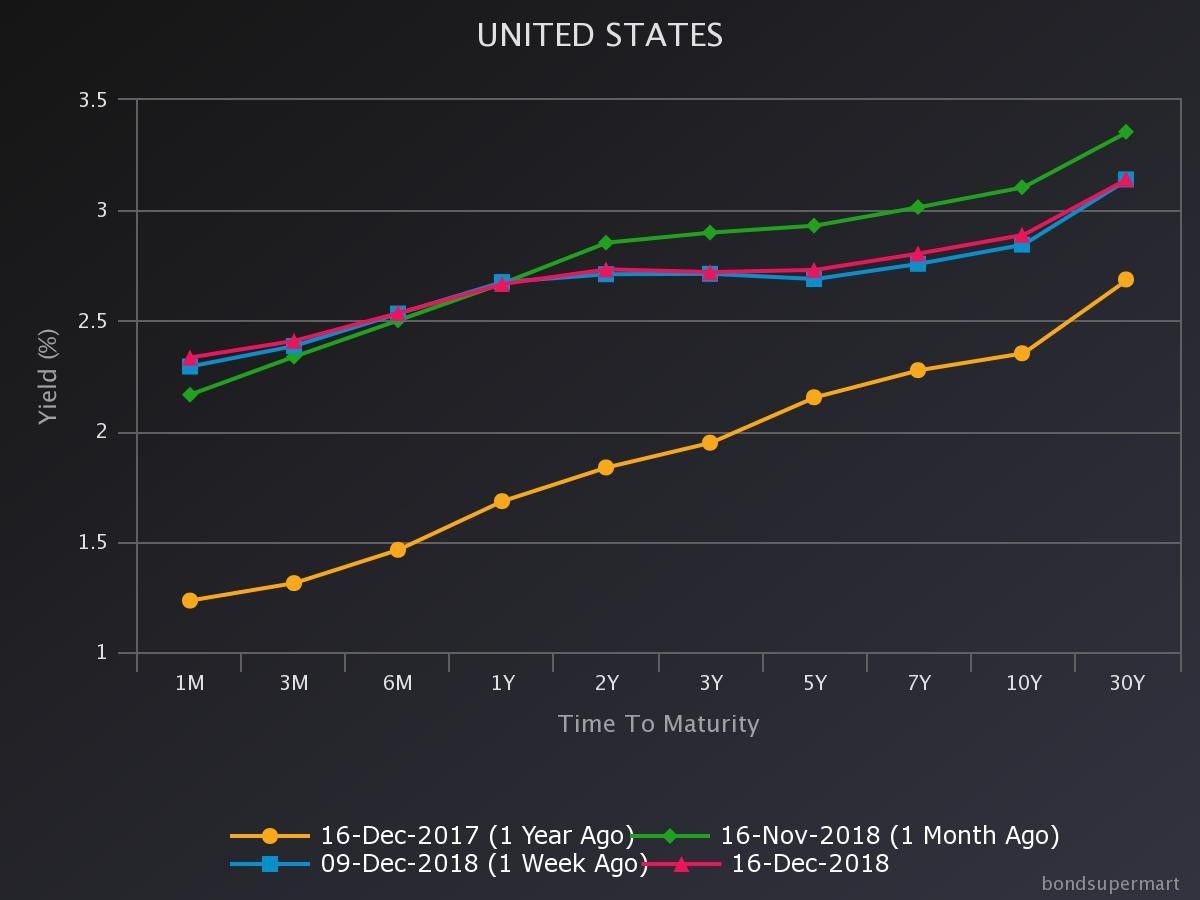
The orange colored yield curve (from one year ago) is a typical structure. The slope of the line moves from lower right to upper left which means the longer the bond’s length of the time until maturity the higher the interest rate. Lenders demand this higher rate as longer time periods have more uncertainty and unknowns.
As the above chart also shows, the shape of yield curve has changed and the slope of the treasury yield curve has declined (flattened). This means that short term rates have increased while the long end has declined. The rise in short term interest rates is easy to explain – the Federal Reserve has increased the federal funds rate for the last couple of years and this part of the treasury yield curve is highly responsive to the Fed.
The long end of the curve has been a different story. Within the last month, the 10 and 30-year maturities have declined. This is illustrated by the change of the green line (November) with the red and blue lines (both December).
The decline in the long end on the yield curve is a mystery. With a strong economy, such as now, the longer maturing rates should be moving up. There is normally more demand for capital as the economy expands and this usually results in higher interest rates especially in long maturities as this finances capital investment.
The drop in the long end of the Treasury curve have traders looking for more clues. Some worry that it could be signaling an upcoming slow down. And certainly the global economies have slowed as both Germany and China reported disappointing data last week.
Another development causing some confusion is recent statements from Fed Chairman Jerome Powell. On October 3rd, the Fed Chairman spoke about interest rates and future increases, “We may go past neutral. But we’re a long way from neutral at this point, probably”[i]. Neutral refers to the Fed target level. The Fed Funds rate was 2.18% on that day.
A little over a month later in late November, Mr. Powell said, “Funds rate is just below the broad range of estimates of the level that would be neutral for the economy.”[ii] The Fed Funds rate was at 2.2%.
Some investors called for a timeout to review the video tape. What just happened? What caused Powell to go from “long way from” where we need to be to “just below” the target rate while the interest rate didn’t move? And to do it within two months.
There was no noticeable change or deterioration the economic data. There was no international flare up beyond the ongoing dialogue and digs that have taken place throughout 2018. The only obvious reason for the change was the stock market which had a terrible October and November.
As a reminder, the Federal Reserve’s assigned tasks are maximum employment and stable prices. It’s not clear when the level of the Dow became their concern but Wall Street has had the view that the Fed would pull out all stops to save the financial markets since the time of Alan Greenspan. Powell seems to following in the footsteps of Greenspan, Bernanke, and Yellen.
The decline in yields in the treasury market could also be a flight to quality. It’s not much of a strain on the imagination to think of possible landmines that would cause a shift toward safety. Deutsch Bank has been struggling for years and its failure would cause ripples throughout the global financial system. There are bloody riots in Paris with calls for President Macron’s resignation. Then throw in Brexit, Italy, Turkey, Argentina, China and Russia.
The U.S. Treasury market is considered to have very little credit risk so it is a “go to” security when global institutions are looking to reduce risk. If traders are fearing a systemic credit issue, buying U.S Treasury bonds would be a natural decision. This could be a part of the lower yields reflected in the above graph.
Liquidity is a crucial part to the markets and the institutions that operate within them. The availability of money and credit might be shrinking. Certainly the Fed has been shrinking its balance sheet at the same time that they’ve been raising interest rates. The European Central Bank hasn’t raised interest rates but they have cut back on amount of bond buying which injects funds into the system.
There are other signs of contracting liquidity. According to The Financial Times, there has not been a bond offering in the high-yield corporate bond market in December. The last time this happened was November 2008 or just as the financial crisis was taking hold.[iii]
While this may seem like an unimportant development, the high yield corporate bond market exceeds $1.2 trillion so this is not an obscure fixed income market. And while December is not a hot month for offerings, deals obviously got done in previous Decembers. This could be another sign that there is a liquidity or credit problem lurking.
The overall capital market picture is has changed. Stocks have fallen, the bond market is acting strangely, the dollar is strengthening, and oil has dropped 40% in two months. The mystery behind these various gyrations is not easy to solve. And while there are many suspects with plenty of motives, maybe the answer is that the markets are calling the bluff of an over indebted system with no plan to fix its problems. If this is the case it means that we’ve only begun the game of solving financial system mysteries. And they will probably get a lot harder.
[i] Doubleline Funds, December 11, 2018
[ii] Ibid
[iii] The Financial Times, December 16, 2018