
December Distractions

Kerr Financial Group
Kildare Asset Mgt.
Jeffrey J. Kerr, CFA
Newsletter
November 29, 2021 – DJIA = 34,899 – S&P 500 = 4,594– Nasdaq = 15,491
December Distractions
With Thanksgiving behind us, it’s a furious rush to Christmas and the New Years. Everyone will be checking their list and probably more than twice. Adding to the typical seasonal madness this year is a nonstop news flow of covid variants, possible shutdowns, destructive inflation, supply chain shortages, and intense cultural division. It’s enough to distract the most devoted traders from what’s going on in the markets. It could also divert individual investors from considering possible tax saving year-end strategies.
Acknowledging that our readers are no less harried, we’ll briefly offer some thoughts on both the markets and tax strategies. First, some tax reduction steps. Maxing out retirement plans contributions such as 401Ks, IRAs, and similar plans can be done in December. This reduces taxable income or provides a deduction on your taxes.
Secondly, funding a Health Savings Account (HSA) is a way of reducing taxes. HSA’s are open to individuals with high deductible health plans (HDHP) and contributions to the HSA are tax deductible. The 2021 contribution limits are $3,600 for an individual and $7,200 for a family. HSA’s are open to a wide part of the population but are underutilized.
Finally, tax loss harvesting involves selling investment positions that are showing a loss. Net losses up to $3,000 per year are deductible on your tax return. The trades have to done before December 31, 2021, in order to qualify for 2021 taxes. Contact us if you need more information or have questions concerning any of these strategies.
Concerning the markets, we began the week after experiencing a painful plunge on Friday. It was the worst day of 2021 for the Dow Jones Industrial Averages as it tumbled 900 points. Thankfully, the markets were only open half day for the Thanksgiving weekend.
This “Black Friday” in the markets was triggered by worries over a new covid strain in South Africa. Fears of economic shutdowns grew as the Biden administration announced the start of travel bans from South Africa and 7 other countries. Of course, the losses were widespread as the S&P 500 and Nasdaq’s drops were similar the Dow’s.
While the over 2% declines for the major averages were unpleasant, three trading days prior saw fresh all-time highs for the S&P 500 and Nasdaq Composite. At the end of last week, the major averages still showed strong year-to-date gains. Here is the year-to-date performance for the major averages as of November 26.

As gloomy as Friday was, there are reasons to think it is not a replay of the March 2020 drop on the initial shutdown. First, there are signs of economic growth. Mortgage applications have been increasing and manufacturing PMI (purchase manager activity) was greater in November than October. Finally, personal income increased and came in higher than forecast.
To be sure the economy is far from healthy and we all know some worrisome signals. However, there are some signals that stocks could trade higher in the short term. First, there are rumors that many hedge funds, traders, and institutions are underperforming the markets. With one month left, they will likely have to add exposure to narrow the gap. If this is accurate, it could provide a floor for prices.
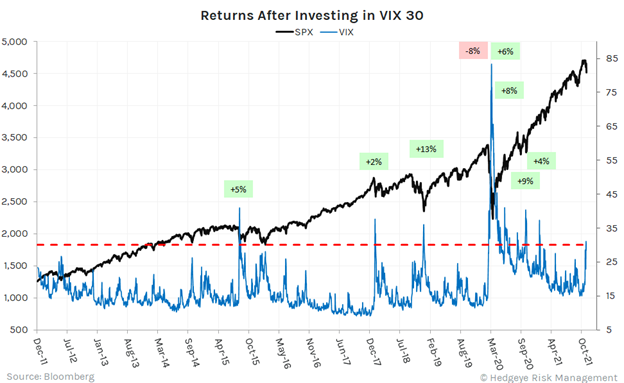
Next, last week’s selling could have marked an inflection point. The VIX has reached levels that have coincided with previous market bottoms. First, the VIX is an index derived from options on the S&P 500. It is intended to gauge trader sentiment with higher numbers meaning greater fear.
The VIX recently moved above the 30 level. Hedgeye Risk Management reports that this might be an important stock market bottom. According to Hedgeye[i],
· Over the last decade, the VIX has breached 30 exactly 9 times
· If you had bought the VIX when it breached 30, you would have made money 8 out of 9 times over the next 30 days
· The average gain was +6% for the SP500 over those periods
· The only time this batting average didn’t hold was in March 2020.
Here is a chart comparing the VIX to the S&P 500 during the past decade. As can be seen, the VIX spends a lot of time trading in the teens. Also, we can see the performance after the 9 instances of trading above 30. Of course, there are several similarities with the March 2020 (the one time where the S&P 500 fell after a VIX above 30) and now. It could easily result in a 2 out of 10 outcome.
In the sprint to the end of the year that many of us will be caught in, it will be easy to take our eye off the capital markets. And perhaps this is good – a kind of Hanukkah or Christmas gift. Nevertheless, some will want to look at some tax saving strategies as well as trading opportunities. Contact me if we can help you.
[i] Hedgeye “Early Look”, December 3, 2021