Who’s Afraid of the Big Bad Wolf?
The stock market has been on a historic run since the election. A steady series of record highs in spite of a landscape of protests, name calling, and divisiveness. Given the elevated level of widespread acrimony, one would logically expect stocks to be broadly lower instead of at all-time highs. Nevertheless, there hasn’t been a meaningful correction since the before the election. Two weeks ago, the major averages had their largest weekly loss of 2017 and it was first time the S&P 500 had a down week in a month and one-half. It also ended a seven-week winning streak for the Nasdaq and four consecutive advancing weeks for the Dow.
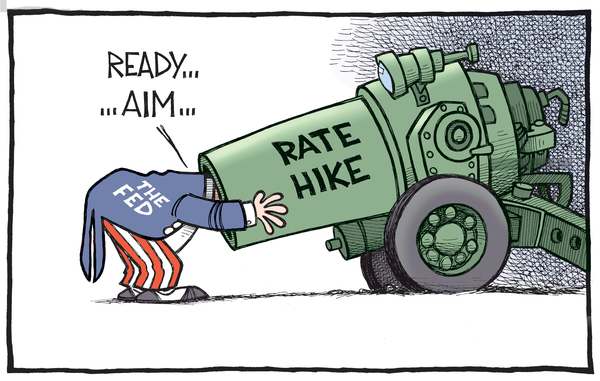
The averages got back on the winning side last week thanks to a spike higher on Wednesday afternoon after the Federal Reserve’s increased the federal funds rate 25 basis points. Since a rate hike was widely expected, this decision was discounted. Instead, the rally was driven by dovish comments by Janet Yellen concerning future rate increases. The market had begun to fear four increases in 2017 which could push against economic growth. But, after Wednesday’s press conference, the markets are now expecting only two more in 2017 (three total for the year).
Of course, higher interest rates result in increased borrowing costs and lower profits. Not the typical recipe for a good stock market. Furthermore, higher interest rates result in lower present values of future cash flows i.e. lower asset prices. However, past Fed tightening cycles have not always translated into troubled markets. The table below shows the returns for stocks, bonds, and cash during past periods that the Fed was increasing interest rates.[i] Surprisingly, these asset classes do quite well during rising interest rates. As can be seen, stocks averaged a gain of +21.61% during the 15 cycles since 1958. Even fixed income and cash have historically done well, +5.77% for bonds and +10.26% for cash. Maybe the markets’ current worries are focused on the wrong area – it wouldn’t be the first time.
The danger of rising interest rates might increase after the last rate hike. Below is another table showing the average returns for stocks, bonds, and cash after the last rate increase of a cycle.[i] As can be seen, the average returns one year after the cycle ends are much lower for stocks and cash (+8.79% and +6.71% respectively) but better for bonds (10.08%). The average annual returns for the five years after the end of the cycle is 10.79% for stocks, 9% for bonds and 5.77% for cash.
A couple of notable and worrisome numbers are the returns after the last two tightening cycles. Stocks did poorly after both examples down 14.83% in 2000 and down 13.12% in 2007. Of course, these were the bursting of the tech bubble and the beginning of the financial crisis, but it causes one to wonder if another bout of higher interest rates will lead to another crisis.
We reached another stock market milestone two weeks ago – the 8-year anniversary since stocks bottomed in March 2009. Much has changed in 8 years. First, investor psychology is very different. It hasn’t traveled the typical journey from deep bearishness to widespread optimism. Instead there remains a general mistrust of the capital markets combined with the begrudging acceptance that some level of exposure to the stock market is required.
This mistrust is an extension of a lack of confidence in our financial leaders and regulators. One of the reasons the Federal Reserve was created was to prevent these types of meltdowns. Yet we suffer through a stock market bubble followed by a systemic crisis and the central bank’s response is more of the same approach that led us into these messes. The public recognized that money printing in the form of programs such as TARP and QE together with lowering interest rates was the same old stuff and they didn’t trust it. The markets eventually stabilized but it’s debatable whether the reason was central bank policy or the internal, self-clearing market mechanisms.
Another notable difference between March 2017 and March 2009 is the composition of leaders. There are several currently popular stocks that weren’t around 8 years ago. Facebook came public in May 2012. Tesla’s IPO was June 2010. Other significant IPO’s during this time period were Twitter (November 2013) and Alibaba (September 2014). At a minimum, this shows that the markets continue to evolve and move forward.
Returning to 2017, as mentioned, it has been a good year so far and there are some signs that it will continue. We recently passed the 50th trading day for the year and, at that time, S&P 500 was up 6.03%. Since World War II when the S&P 500 is up at least 5% at the 50th trading day of the year, stocks have a remarkable history of continuing higher. Of the 22 prior occurrences, the S&P 500 added to those gains 21 of those years. The average gain was 12.16% in the remainder of the year. Sticking with this indicator, gains can be stronger in the first year of a presidential cycle with 5 prior examples – 1961 +12.89% the rest of the year, 1985 +18.57%, 1989 +19.74%, 1997 +6.67%, and 2013 +9.61%.[i]
Events over the past year give pause to confident predictions and using history as a guide to the future. Maybe this will be one of those rare years where the first 50-day rally fizzles. Furthermore, the current landscape in Washington looks to be changeable. Given that much of the Trump rally has been driven by anticipated changes in tax code and business regulations, the markets could be susceptible to disappointment if there are delays or cancellations of this agenda.
Add to these crosscurrents and confusion the fact that the Federal Reserve will be raising interest rates again later in the year. Then mix in the valuation backdrop of a pricey stock market at all-time highs and we have markets that could use a correction. In the short term, we have end of the 1st quarter approaching which is normally supportive of equities. Perhaps we get a pullback next month. If that happens it could recharge the bulls for another leg higher. Of course, this assumes the economy strengthens and Washington pushes through the expected changes. This promises to be an interesting year.
Jeffrey J. Kerr, CFA
Kerr Financial Group
Kildare Asset Management
130 Riverside Drive
Binghamton, NY 13901
[i] Bloomberg, March 10, 2017
[ii] ibid
[iii] The Bespoke Report, March 17, 2017


Leave a Reply
Want to join the discussion?Feel free to contribute!