


The stock market is having a great start to 2020 which, of course, follows an outstanding 2019. The large cap indexes are up 1.5% or more in the first 17 trading days. The Dow Jones Industrial Average closed over 29,000 for the first time and the Nasdaq rallied above 9,000 also for the first time. The S&P 500 has had only 6 down closes since the start of the year.
Oddly, it’s become necessary to publicize these kinds of financial market developments. Since the stock market has been on a steady upswing since Labor Day, the public has been infected with a sense that the markets can only go up. Of course, this is not true but the human mind can be strong and convince us of untruths. As a reminder, high levels of complacency can be dangerous as the stock market is risky, especially as prices move higher.
In addition to contentment, investors have been overwhelmed by other important headlines. The elimination of Qasem Soleimani and Iran’s retaliation certainly deserved the country’s attention. And calls by the talking heads that we were on the brink of World War III also caused many to focus outside the day’s financial news.
Naturally, the impeachment of President Trump is an important event. This is a historic period in time with significant cultural division approaching civil war type emotions. Nevertheless, the impeachment hearings might not be as big a distraction as the broadcast of the proceedings captured few viewers. Afternoon soap opera ratings were higher than the Democrats’ argument for removing the president.
Beyond these issues, there has been plenty of exciting football with the college bowl games followed by the NFL playoffs. Further, we’ve had the resignation of Prince Harry and Meaghan Markle from the Royal Family (Megxit), the hypocrisy of Davos, and the possibility of Brad and Jennifer getting back together. That’s clearly a full plate and tough competition for repetitive all-time highs in the stock market.
As challenging as it is, many are squeezing in the time to keep an eye on the markets. In summary, they are seeing stocks moving up and interest rates moving down. As mentioned, equities had a strong finish to 2019 which has continued in 2020. The leaders have been large companies, the technology sector, and growth stocks. Here are how the major averages are performing for 2020.
2020
Dow Jones Industrial Average +1.6%
S&P 500 +2.0%
Nasdaq Composite +3.8%
Russell 2000 -0.4%
The most unexpected stock market news in 2020 is that the Dow Jones Utility Index is the best performing index year-to-date. The “Utes” are up 6% in 2020. A utility is considered a slow growth company and these stocks are viewed as defensive investments. They are the antithesis of technology and momentum stocks.
The rate a utility charges their customer is usually controlled by a state government or commission so revenue growth is often controlled. Moreover, these businesses typically carry high debt levels as they borrow to build long-lived infrastructure from which they supply their customers the electricity, water, gas, etc.
Ironically, it is this large debt load, usually a drag on a company, that is helping. Because of their debt, utilities are sensitive to interest rates – lower rates equals lower interest expense and vice versa. Interest rates have fallen throughout January and investors have been buying utilities.
Concerning interest rates, the 10-year Treasury yield began the month around 1.9% and closed last Friday at 1.64%. This is a big drop in the fixed income market and it helped energize the utilities index. The 30-year Treasury bond’s yield has fallen from around 2.4% to below 2.1%.
The Federal Reserve has played a role in both the stock markets’ rise and the decline in interest rates. Since September the Fed has been providing the financial system liquidity through a short-term interbank lending system referred to as the repo market. “Repo” is short for purchase agreement and it is a loan from one bank to another in exchange for collateral (often Treasury bills). These transactions are short term, often overnight.
Normally, banks work out imbalances between themselves via the repo market although the Fed has played the role of lender of last resort if needed. For the first time since the financial crisis 10 years ago, the Fed became active in this market. There hasn’t been a clear reason why they suddenly got involved. Some theories center on regulatory requirements surrounding the collateral and liquidity thresholds that banks are to keep.
Whatever the circumstances behind this development, there is no debate that the Fed’s involvement has injected liquidity into the system. The Fed insists that this is not another round of “quantitative easing” and further believe that it will be temporary. While the mechanics are different from prior QE efforts, the result looks similar to other stimulus programs.
Below is a chart showing the size of the Federal Reserve’s balance sheet. As can be seen, it was steady at around $4.5 trillion from 2015 through 2017. As was announced by the Chairman Powell, there was a move to reduce the size of the assets in 2018 which coincided with capital market turmoil in late 2018. This translates into the financial system getting disrupted when the Fed raised interest rates and withdrew money from the system.
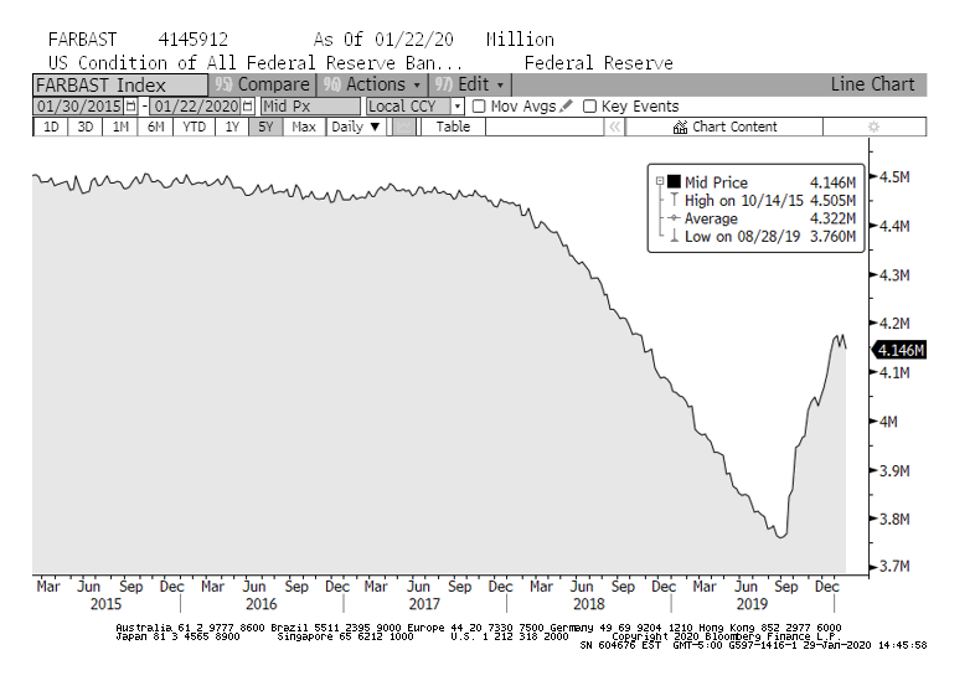
The Fed’s involvement in the repo market is clearly shown in the “V” shaped reversal in in the assets held in September. There is an approximately $450 billion injected in the banking system via the Fed’s role in the repo market since September.
Even if the Fed is not considering their repo involvement a formal policy, the markets think it is close enough. The stimulus is at the short end of the fixed income market but indirectly impacts longer maturities and lowers yields. Lower yields reduce corporate interest expenses and improve bottom lines. In general, easy money helps economic activity which drives stock prices.
There is an appearance that the Fed has generated a financial utopia. However, creating money (without corresponding value) and pushing it into the system cannot go on forever. It can cause misallocations of capital which can lead to bubbles.
For now, that does not appear to be a concern. Confidence in the Fed is boundless and the capital markets are clearly seeing a glass half full. Nevertheless, there are many economic blemishes. The global economy is struggling, citizen led protests are everywhere, and geopolitical tensions are high. Apparently, investors think these issues have little consequence. Let’s hope it’s not a case of too much focus on the Royal family.

The stock market has been on a historic run since the election. A steady series of record highs in spite of a landscape of protests, name calling, and divisiveness. Given the elevated level of widespread acrimony, one would logically expect stocks to be broadly lower instead of at all-time highs. Nevertheless, there hasn’t been a meaningful correction since the before the election. Two weeks ago, the major averages had their largest weekly loss of 2017 and it was first time the S&P 500 had a down week in a month and one-half. It also ended a seven-week winning streak for the Nasdaq and four consecutive advancing weeks for the Dow.
The averages got back on the winning side last week thanks to a spike higher on Wednesday afternoon after the Federal Reserve’s increased the federal funds rate 25 basis points. Since a rate hike was widely expected, this decision was discounted. Instead, the rally was driven by dovish comments by Janet Yellen concerning future rate increases. The market had begun to fear four increases in 2017 which could push against economic growth. But, after Wednesday’s press conference, the markets are now expecting only two more in 2017 (three total for the year).
Of course, higher interest rates result in increased borrowing costs and lower profits. Not the typical recipe for a good stock market. Furthermore, higher interest rates result in lower present values of future cash flows i.e. lower asset prices. However, past Fed tightening cycles have not always translated into troubled markets. The table below shows the returns for stocks, bonds, and cash during past periods that the Fed was increasing interest rates.[i] Surprisingly, these asset classes do quite well during rising interest rates. As can be seen, stocks averaged a gain of +21.61% during the 15 cycles since 1958. Even fixed income and cash have historically done well, +5.77% for bonds and +10.26% for cash. Maybe the markets’ current worries are focused on the wrong area – it wouldn’t be the first time.
The danger of rising interest rates might increase after the last rate hike. Below is another table showing the average returns for stocks, bonds, and cash after the last rate increase of a cycle.[i] As can be seen, the average returns one year after the cycle ends are much lower for stocks and cash (+8.79% and +6.71% respectively) but better for bonds (10.08%). The average annual returns for the five years after the end of the cycle is 10.79% for stocks, 9% for bonds and 5.77% for cash.
A couple of notable and worrisome numbers are the returns after the last two tightening cycles. Stocks did poorly after both examples down 14.83% in 2000 and down 13.12% in 2007. Of course, these were the bursting of the tech bubble and the beginning of the financial crisis, but it causes one to wonder if another bout of higher interest rates will lead to another crisis.
We reached another stock market milestone two weeks ago – the 8-year anniversary since stocks bottomed in March 2009. Much has changed in 8 years. First, investor psychology is very different. It hasn’t traveled the typical journey from deep bearishness to widespread optimism. Instead there remains a general mistrust of the capital markets combined with the begrudging acceptance that some level of exposure to the stock market is required.
This mistrust is an extension of a lack of confidence in our financial leaders and regulators. One of the reasons the Federal Reserve was created was to prevent these types of meltdowns. Yet we suffer through a stock market bubble followed by a systemic crisis and the central bank’s response is more of the same approach that led us into these messes. The public recognized that money printing in the form of programs such as TARP and QE together with lowering interest rates was the same old stuff and they didn’t trust it. The markets eventually stabilized but it’s debatable whether the reason was central bank policy or the internal, self-clearing market mechanisms.
Another notable difference between March 2017 and March 2009 is the composition of leaders. There are several currently popular stocks that weren’t around 8 years ago. Facebook came public in May 2012. Tesla’s IPO was June 2010. Other significant IPO’s during this time period were Twitter (November 2013) and Alibaba (September 2014). At a minimum, this shows that the markets continue to evolve and move forward.
Returning to 2017, as mentioned, it has been a good year so far and there are some signs that it will continue. We recently passed the 50th trading day for the year and, at that time, S&P 500 was up 6.03%. Since World War II when the S&P 500 is up at least 5% at the 50th trading day of the year, stocks have a remarkable history of continuing higher. Of the 22 prior occurrences, the S&P 500 added to those gains 21 of those years. The average gain was 12.16% in the remainder of the year. Sticking with this indicator, gains can be stronger in the first year of a presidential cycle with 5 prior examples – 1961 +12.89% the rest of the year, 1985 +18.57%, 1989 +19.74%, 1997 +6.67%, and 2013 +9.61%.[i]
Events over the past year give pause to confident predictions and using history as a guide to the future. Maybe this will be one of those rare years where the first 50-day rally fizzles. Furthermore, the current landscape in Washington looks to be changeable. Given that much of the Trump rally has been driven by anticipated changes in tax code and business regulations, the markets could be susceptible to disappointment if there are delays or cancellations of this agenda.
Add to these crosscurrents and confusion the fact that the Federal Reserve will be raising interest rates again later in the year. Then mix in the valuation backdrop of a pricey stock market at all-time highs and we have markets that could use a correction. In the short term, we have end of the 1st quarter approaching which is normally supportive of equities. Perhaps we get a pullback next month. If that happens it could recharge the bulls for another leg higher. Of course, this assumes the economy strengthens and Washington pushes through the expected changes. This promises to be an interesting year.
Jeffrey J. Kerr, CFA
Kerr Financial Group
Kildare Asset Management
130 Riverside Drive
Binghamton, NY 13901
[i] Bloomberg, March 10, 2017
[ii] ibid
[iii] The Bespoke Report, March 17, 2017