
2nd Quarter Review Letter sent to Clients
The following is a copy of the 2019 2nd quarter letter sent to clients. It reviews the markets and the client account’s activity and performance for the 2nd quarter of 2019.
One of the goals of a business is to be profitable. Of course, the end doesn’t justify the means and the path to profitably is important. The typical trail to success involves offering a desired product or service at a reasonable price. Controlling expenses is critical so there must be focus on the cost side of the equation as well. Combine these efforts (some added luck is always helpful) and the result is hopefully a prosperous organization.
If all goes well and an organization becomes successful, the management will need to decide the best use of the excess cash. Thanks to the Federal Reserve, the return on money is very low and barely above the inflation rate. This forces businesses to look for other options.
There are several reasonable possibilities available. The company can pay a dividend to the owners. This is not the most tax efficient use as it is not tax deductible for the business and is taxable to the recipient. Another option is to pay down any existing debt (bonds or bank loans). A further alternative is to expand the business through purchase of additional plant and equipment. Also, a similar move is to acquire another business.
While these choices are all legitimate considerations for cash, another option has risen to become the favorite of publicly traded companies. Share buybacks or purchasing shares of your company in the open market has become an important part of corporate finance. Companies have been very active buyers of their own stock in recent years. And, best of all, if your company doesn’t have the liquidity to execute the buyback, it’s no problem because the bond market has been happy to finance the effort.
Stock buybacks were not always so popular. In fact, before 1982, it was illegal. Regulators viewed it as manipulation of stock price if corporations were able to buy their own stock. Things have changed a lot over the years. Now a company’s stock price is scorned if they aren’t buying back their own shares.
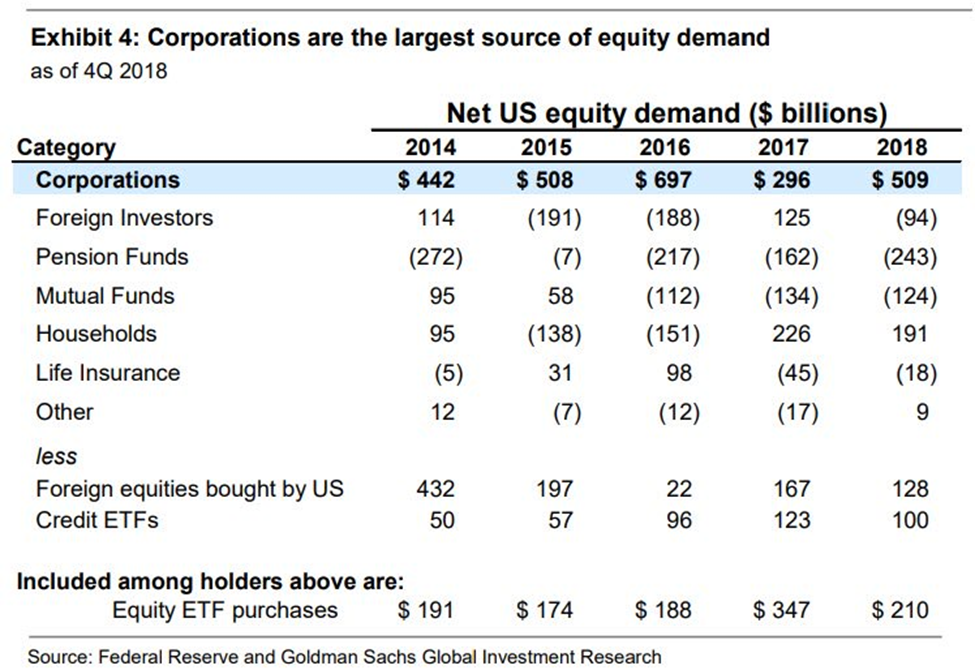
The graph below lists the sources of demand for stocks in the U.S. markets duringrecent years. It shows the overwhelming amount that is purchased by corporations. Corporations is the largest category in every year, and it is the only one that is positive in all years.
Clearly buybacks are an important part of the stock market and has been a tailwind for many years. Another essential player in the corporate buyback craze is the bond market. Fixed income investors have continually provided liquidity to corporations by absorbing the constant flow of offerings. And with widespread demand comes attractive interest rates.
These low interest rates are courtesy of the policies of the global central banks which have held interest rates low. On top of holding down interest rates, the Fed, European Central Bank (ECB), and the Bank of Japan have flooded the system with money. This combination results in large pools of money seeking a return.
Another indication of the importance of stock buybacks is the high amount of cash flow devoted to these programs. As the graph below indicates, over 100% of the S&P 500’s free cash flow is now being used for dividend payments and stock repurchase. Free cash flow is generally thought of as cash that remains after maintaining the company’s capital investments. In other words, upkeep on plant, property, equipment, and other long-lived assets.
Corporate managers must prioritize how they use capital and, as mentioned above, there are many worthy options. The ratio has been at this level or higher in the past, but the current deployment shows how central this is for corporate America.

IBM is one of the world’s greatest success stories. They are a model for success with its history of innovation and execution. It is also a posterchild example of this corporate strategy. Big Blue’s long debt totaled a little more than $18 billion in 2000. It has almost doubled to $35.5 billion at the end of 2018. The use for at least part of this money shows up in a significant reduction in the number of common shares. In 2000, IBM had almost 1.8 billion shares outstanding. That number is approximately half at the end of 2018 coming in around 900 million.
This reduction in share count produces a huge lift in the earnings-per-share calculation without growing the business. The same dollar amount of earnings in 2000 would be twice as much in 2018 when measured on a per share basis. In other words, earnings per share, an essential Wall Street financial measurement, increases without expanding sales and profits. All things being equal, this will translate into a higher stock price. It’s no wonder that this has become such a widespread corporate strategy
This additional debt load is not lost on the credit rating agencies. IBM was once rated AAA (the highest) but has fallen to an A rating. This financial deterioration is a material reason for this. Apparently, conditions haven’t stabilized at this iconic company because Moody’s issued a credit downgrade in July.
As judged by IBM’s stock price appreciation in 2019, investors are willing to forgive the blemishes on the balance sheet. Also, it’s important to remember that IBM is in the Dow Jones Industrial Average and S&P 500. This means if the markets are up, it’s a pretty good chance that IBM is participating.
This has been the case. The stock market, as measured by the S&P 500, just finished its best first half of the year since 1997. As a reminder, this rally was preceded by the worst “December” since just after the 1929 stock market crash. Also, the 4th quarter of 2018 saw a peak to trough drop of 20%. Finally, 2018 was a bad year across many markets as over 90% of all asset classes lost money. Once again, we must go back to the start of the Great Depression to find anything close to this.
It’s natural for markets to bounce after such widespread declines but it’s difficult to figure out the rebound’s timing and length. Part of this process is involves the reasons for the previous turmoil which is difficult to do in real time.
There were a couple of possible sources surrounding 2018’s selloff. The Chinese currency was falling in value against the dollar which increased worries over a systemic problem. Also, tariff and trade war concerns were a constant economic anxiety. Finally, interest rate increases and balance sheet contraction by the Federal Reserve was big market hindrance throughout the year.
While all three were contributors, with hindsight, it appears that the tighter policy by the Fed was the chief culprit. As part of a one-quarter point interest rate increase in December, Fed chairman, Jerome Powell, announced that the balance sheet reduction program was on ‘autopilot’. This meant tighter monetary conditions something the market don’t like. The S&P 500 plunged around 10% in the next week.
In the first week of January, a few weeks after the rate hike decision, Mr. Powell announced a more flexible stance which became to be known as the Powell Pivot. It helped drive U.S. stock prices higher and bond yield lower for the first half of 2019. It is a remarkable reversal that the year began with forecasts of 2 to 3 Federal Reserve interest rate increases in 2019. Seven months later the Fed cuts rates for the first time in over a decade.
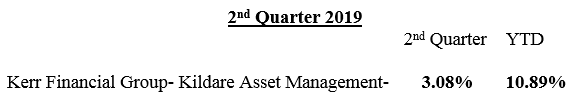
The returns for stocks and bonds for the first six months were not without challenges. Continued tariff concerns, geopolitical problems, civil division, and an unknown monetary policy were part of the lengthy list of problems the markets faced. Despite these issues, earnings and economic growth outweighed the negatives and helped push financial assets higher. Here are the major averages’ returns for the 2nd quarter and year to date.

Using a size weighted average, here is how the average Kildare Asset Management-Kerr Financial Group client’s account performed. This is calculated after all fees and expenses.
Looking within the accounts, a couple of developments to note. During the quarter, Pan American Silver Company (symbol is PAAS) became a precious metal play. Gold started to move higher at the end of May and broke out of a trading range in June. I had feared that I missed the move in gold and wanted to wait for a pullback to begin accumulating positions.
Realizing that the price of silver had not rallied as dramatically as gold, I used silver as a cowardly way of having precious metal exposure. While gold and silver can be viewed as complementary, they do not always move together. This ratio recently reached its highest point in over 25 years – meaning gold was historically high relative to silver. If there is a forthcoming return to the mean trade, silver will outperform gold.
Pan American Silver was founded in 1994. It is one of the largest silver mining companies in the world and their mines are in generally safe countries with friendly governments. Pan American’s flagship mine is La Colorado in Mexico which is expected to produce 8.1 million ounces of silver in 2019. The company is profitable and has 1.3 billion ounces of silver equivalent reserves.
Precious metal investments are historically considered safe havens and can offer protection during inflationary periods. Gold and silver have gained additional interest within today’s environment of negative interest rates. Bonds and other securities that have a yield are in competition with these metals for investor capital. Negative interest rates reduce this competition and make precious metal more attractive. This position might be added to if there is a price correction and the global financial conditions deteriorate.
Bath Bed and Beyond (symbol is BBBY) is another 2nd quarter addition. The company has over 1,500 stores two-thirds of which are the namesake brand. The next biggest and other recognizable name is Christmas Tree Shops. Of course, as is the case for every retailer, Bed Bath and Beyond has invested and enhanced their e-commerce platform.
The challenges facing the retail industry are widely known. Going to the mall is no longer a popular pastime. Competition, the internet, and potential tariffs has squeezed margins. All retailers are forced to transform the shopping experience to keep their customers as well as attract new ones.
BBBY is expected to generate around $12 billion of sales in fiscal year 2020 (the current year). The bottom line is forecast to be slightly less than $2.00 per share. They have a strong balance sheet with a little less than $1 billion in cash and $2.6 billion in inventories. There is $1 billion of accounts payable and $1.5 billion of long-term debt.
Of course, little of this matters when a sector falls out favor with investors. The result is the peculiar situation where Bed Bath and Beyond’s dividend yield is higher than its P/E ratio (prices-to-earnings). The P/E is below 5 while the dividend yield is above 6%. Concerning the dividend, management just raised it which demonstrates their confidence in future cash flows (when a company increases its dividend it is a long-lasting decision that not normally reversed).
Investors want nothing to do with retail and there are many good reasons for this. However, as troubled as conditions are, many remain profitable and offer good long-term value. Bed Bath and Beyond is an example of investors overlooking a company’s financial strength and potential. We are down on our BBBY investments. However, these are smaller positions that will be increased at better prices. I think the stock will rebound in the future.
The markets are likely to face many trials in the second half of 2019. While it looks like the Federal Reserve has changed its policy and will be market friendly, there are lots of other issues. The list includes a slowing economy in international markets, trade wars, geopolitical flare ups, and civil unrest.
Domestically, the United States economy is doing well but there are some concerning signs. A few economic data points such as the Purchasing Managers Index have weakened a little. Also, future earnings estimates have been reduced.
The race for the Democratic Party’s presidential candidate will accelerate later this year. While it may not be on the financial markets shopping list yet, there are many economically unfriendly proposals being offered by the 20 plus candidates in the race. It’s safe to say that the markets will not rally with a 70% marginal personal income tax rate.
But the largest problem is the current discussion in Congress about outlawing corporate buybacks. To be sure, buybacks are controversial. However, removing the biggest source of buying would likely be the beginning of material financial market pain.
While it promises to be an exciting period ahead, I will continue to look for opportunities as well as monitor current positions. I think the markets could be volatile and will try to exercise caution in executing decisions. Thank you for your continued support and please call with any questions.
Sincerely,
Jeffrey J. Kerr, CFA


Leave a Reply
Want to join the discussion?Feel free to contribute!