“Never Attempt to Win By Force What Can Be Won By Deception” -May 16th Newsletter


Kerr Financial Group

Kildare Asset Mgt.

Jeffrey J. Kerr, CFA

Newsletter

May 18, 2020 – DJIA = 23,685 – S&P 500 = 2,863 – Nasdaq = 9,014


“Never Attempt to Win By Force What Can Be Won By Deception”i


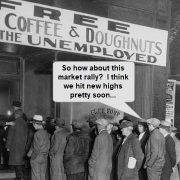
The U.S. stock market’s breathtaking rally from the March lows shows the amount of faith the markets have in fiscal and monetary policies.  As our political and bureaucratic leaders announced larger and larger bailouts and stimulus programs, the stock market climbed higher.  As perception becomes reality, it’s as if the pandemic and economic shutdown never happened.

Of course, this confidence rises out of the fact that we did recover from the financial crisis of 2008 – 2009.  In our collective memories, there is an interconnection between Fed policies and the recovery.  In other words, our recollection is that the Fed saved the day and they’ll do it again.  Funny thing about our memory, it gets fuzzier with the passage of time.

Rewinding 10 years, the path out of the crisis was very unclear.  Initially, the Fed relied on their standard practices of cutting interest rates and printing money.  As that wasn’t effective, they turned to more aggressive programs which began a string of QE’s (quantitative easing) which involved buying treasury and mortgage backed bonds for the first time (as far as we know).

The QE policies, which were supposed to be temporary, turned into pesky weeds that kept growing.  Over several years the Fed continued to introduce new and bigger versions of QE with different names.  Wall Street referred to them as ‘QE’, ‘QE 2’, ‘QE 3’ and finally, realizing their permanence, ‘QE infinity’.  Obviously, they weren’t temporary.

Ben Bernanke and the Fed admitted at the time that these were radical monetary programs with unknown outcomes and consequences.  Further, our central bank leaders characterized themselves as “data dependent” which meant they were unsure of what they were doing.  In the end, the economy stabilized and improved, however, the effectiveness of the Fed is a topic of debate.   But, assisted by a masterful public relations effort, Ben Bernanke and global central banker were credited for saving the world.

Returning to the present, there is a confident belief that Jerome Powell, the Fed, and our elected leaders can do it again.  If they come up short, it won’t be from a lack of trying.  Washington, the Fed, and the Department of the Treasury have joined together to combat the impact of shutting down the economy.  The size of the proposed plans dwarf those previously used.

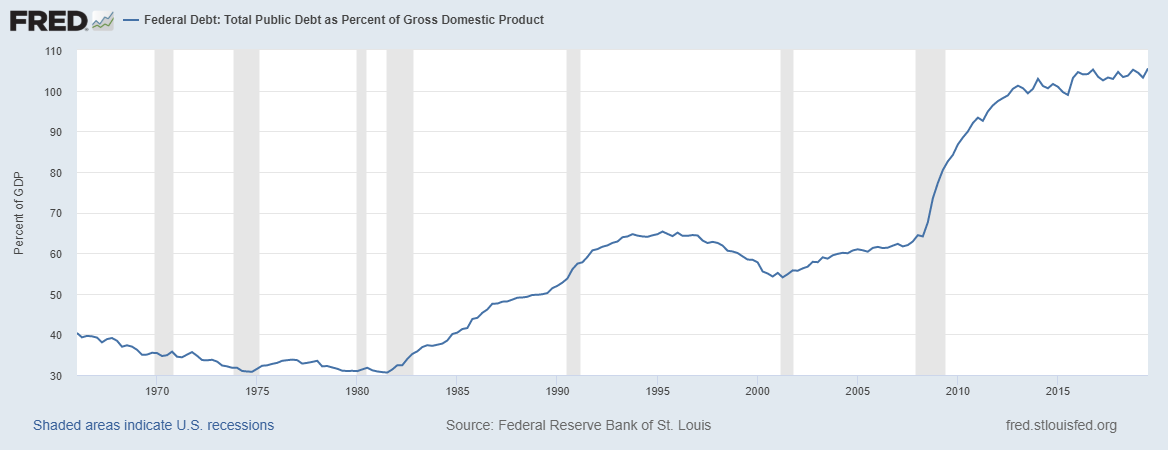
The Treasury recently announced that the Federal government will borrow a record $3 trillion just in the 2nd quarter.  This number will likely move higher throughout the year.  These figures are light years from any amount that we typically deal with and are almost impossible to comprehend.

Of course, these borrowings will be added to the current $22 trillion fiscal deficit (which has doubled in the past 10 years).  A combination of the media’s reluctance to report on these numbers as well as the talking heads telling us there is no other option has desensitized society to their significance.

Welcome to the world of Modern Monetary Theory.  This is an economic view that governments have an unlimited spending ability (kind of what we are doing now).  That’s right – they can spend whatever amount they want without repercussions.  An important part of the equation is the Federal Reserve because they will print the money to buy the Treasury bonds which supplies the spending.

According to MMT supporters (which includes Bernie Sanders), this apparent shell game does not do any economic damage.  The economy gets a steady boost from the federal government and everybody enjoys the benefits.  A presumed utopia.   In the case that inflation surprisingly rises, spending would be reduced until the supply and demand is rebalanced.  It seems, given the path that we are on, the MMT hypothesis could get put to the test.

In addition to anticipating an economic recovery, the stock market also gets excited on news of re-openings, vaccines, and, perversely, bad news (which means greater financial support from the Fed). Last week April retail sales tumbled 16.4% from March’s level.  Naturally, bad news was expected but this was far worse than the 12% drop that was forecast.

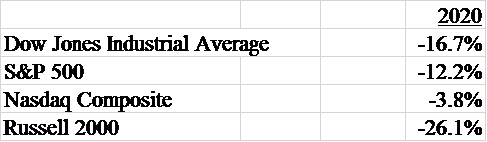
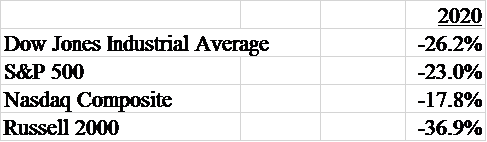
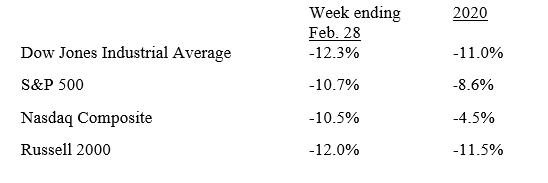
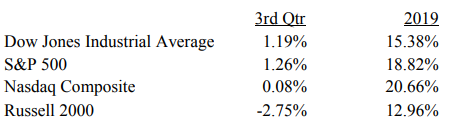
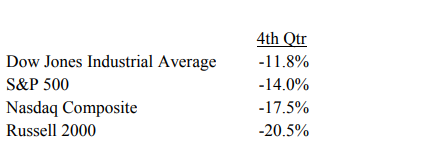
Stocks were lower last week but the selling was contained.  Below is a table of the year-to-date returns as of May 15th.


The U.S. stock markets have bounced over 25% from the March lows and are led by the Nasdaq which ended last week flat for 2020.  It’s interesting that the bounce seems to be uniquely American.  Other major developed and emerging stock markets have not had the rebounds that the U.S. has experienced.  In Europe, France is down 28% YTD, the UK is 23% lower, and Germany is down 21%.  Brazil is down 33%.  In Asia, Japan and Hong Kong are both 15% lower while India is down 24.6%

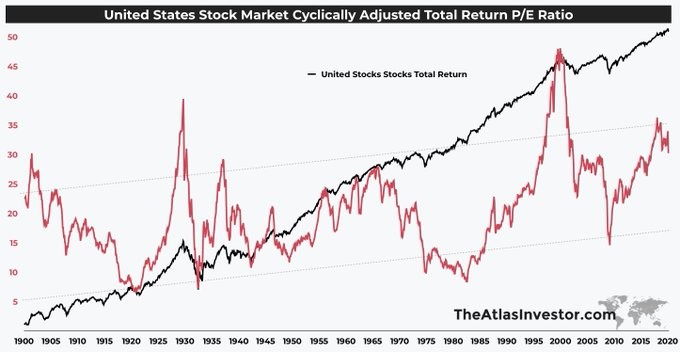
The U.S. is the largest economy in the world and our currency is used for almost all the global trade.  This may have a part in this development.  Nevertheless, the contrast of the U.S. stock market rebound vs. the rest of the world is noteworthy.  Below is a chart of the relative price of the U.S. stock market as compared to the other developed stock markets.

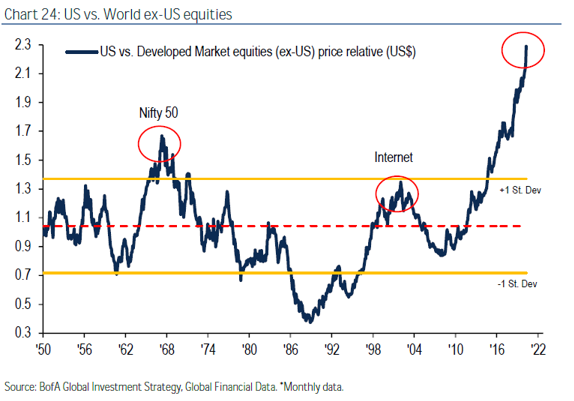
This ratio is the highest it has been in the last 70 years!  This shows the relative price of the U.S. markets being almost 2.5 times the level of the non-U.S. developed economy’s stock markets.  Not only is it at the greatest level, it is extremely out of place with the norm.  Currently it is approximately 3 standard deviations from the mean.

The two other high points were the Nifty 50 markets of the late 1960’s and the Dot Com bubble of 1990’s.  But even these examples are well below the current landscape.  These prior peaks were followed by drops in the U.S. markets and outperformance by international stocks.  Maybe it’s different this time, but this suggests that the international markets will outperform the U.S. at some point in the future.  Keep in mind, this outperformance could come in the form of international stocks declining less than a U.S. drop.

The U.S. stock markets seem to be anticipating a strong recovery and an economic landscape like 2019.  Given our culture’s entrepreneurial spirit, it is possible.  Our history has many examples of bouncing back and overcoming adversity.  However, there has been deep damage and the recovery could take longer than expected.

The Fed has announced mind numbing sized stimulus programs.  In addition, Powell and our political leaders have committed to do more if needed.  (Could buying stocks and negative interest rates be in their future?)  Investors believe in the collective abilities of our policy makers to be successful.  Let’s hope we haven’t overestimated their skills.

[i] Niccolo Machavelli


“Are you telling me that you built a time machine…out of a DeLorean?” -April 27th

Kerr Financial Group

Kildare Asset Mgt.

Jeffrey J. Kerr, CFA

Newsletter

April 27, 2020 – DJIA = 23,775 – S&P 500 = 2,836 – Nasdaq = 8,634


“Are you telling me that you built a time machine…out of a DeLorean?”


As the restlessness of limited social interaction expands to unbearable levels, memories of an unbounded life bring yearnings to a return to our unfettered ways.  Ahh, the good ole days – from just a couple of months ago!

As society looks to de-quarantine, there is a big wish to return to our pre-Covid-19 lifestyles.    But there are many unknowns.  What will be the ongoing health risks?  How do we address them?  What will be the impact on our society?  What will the economy look like?

Putting the science and medicine aside, there is a recognition that things will change.   Stopping by your favorite crowded watering hole for a happy hour cocktail will unleash condemnation.  Social distancing is here to stay.  The workplace will likely see a lot more online meetings as many will spend time working from home.

That is assuming that our workforce regains its previous strength.  We have had the lowest unemployment rate and the best job market in a generation.   But all the jobs created in the last 10 years have been lost in the weeks since the quarantine began.  Certainly, much of this will be temporary.  However, as not every business is going to reopen, higher unemployment could turn into an ongoing inconvenience.

Joblessness assures less money flowing into the economic system.  This will cause less buying by consumers.  In other words, there could be much lower demand for such things as gasoline, clothing, going out to dinner, travel, going to a concert or sporting event, a new car, vacations, and iPhones.

In the face of this risk and uncertainty, there are those who are working to turn our future into our past.  The Federal Reserve is doing everything in its power (and some things not within its power) to contain the economic damage from the shutdown.  They eagerly want to get the U.S. economy to return to something like January 2020.

The breadth and speed at which the Fed is throwing money at the system is unfathomable.  They have committed to buying a wider spectrum of the fixed income market than previous programs.  Newly targeted sectors are municipal and junk bonds. Furthermore, Chairman Jerome Powell has indicated that there will be more if needed.

The total amount of securities purchased and held by the Fed is expected to exceed $10 trillion.  To put this in perspective, this number was approximately $4 trillion at the start of 2020.  Prior to the financial crisis of 2008 – 2009, the Fed’s holdings totaled around $800 billion.  A $9 trillion increase in the involvement in our capital markets is a lot of manipulation.  Adam Smith please meet Karl Marx.

The Federal Reserve certainly has strong support.  Their fans reason that Fed’s QE programs after the last financial crisis worked so well (longest economic expansion in history) that an exponentially larger effort must be the answer.  And this time don’t spread the stimulus over several years, do it big and do it quick.  This, the optimists believe, will be the best and fastest way to get our economic future to go back in time.

The U.S. stock market did not waste any time second guessing our central bank and the various federal government assistant programs.  Stocks have had an amazing bounce from the March lows.  The S&P 500 had rebounded 23% by the end of last week while the Nasdaq has led the way during this rally and closed last week down less than 4% year-to-date.  Below is a table of the year-to-date returns as of April 24th.


While the U.S. stock market has the DeLorean cruising at 88 MPH, some other areas are stuck in 1955.  The bond and crude oil markets are not functioning properly.  Last week crude oil futures (May expiration) traded at negative prices. In other words, buyers of the contract not only acquired the contract they got paid (instead of having to pay for the contract).

The issue behind this anomaly is that there is too much oil and not enough storage.  Crude oil producers continue pumping oil while the demand for refined products has shut down.  At the current rates, forecasts are for the system to run out of available storage by mid-May.  Oil drillers can slow the rate that oil is pumped but complete closure is a lengthy and expensive process.  Unless the Fed starts buying it, crude will likely remain under pressure until demand returns.

For those expecting a quick and complete economic recovery, the treasury bond market is disagreeing.  The 10-year T-note yield closed last week at 0.56% while the 30-year T-bond ended with a yield of 1.17%.  Recognizing that the Fed is trying to suppress yields in this market, if the economy is to regain its strength in the upcoming quarters, treasury bond yields should be moving up.

International economies also conflict with the “V” shaped recovery theory.  Australia is in its first recession in 30 years.  Its main stocks market index fell 4.46% last week and is down 21.6% year-to-date.  Here are some other notable international stock markets’ YTD performances – Brazil -34.9%, France -26.5%, Germany -22%, and India -24.1%.

The Fed has committed a lot of ammunition to support the financial markets which they believe will help the economy make a quick and strong recovery.  If it doesn’t work, they claim they have more tools to use.  Stock market bulls are believers.  Critics point out they are using essentially the same policies that got us into this mess and that they are a big part of a flawed equation.  They predict much more damage.

U.S. stock markets have bounced sharply form the March lows.  At some point, when the economy reopens, pent up demand from a quarantined population will provide an economic jolt.  The hope is that it provides a sustainable return to an upward trajectory and not a short-lived celebration.

As much as we want to return to our pre-pandemic society, that’s not likely to happen – even if we had a time machine.  It is hard to predict the changes that will take place to our lives but things like social distancing and working from home could become normal conduct.  These cultural adjustments will take time and we will adapt.  Actually, there are some people where practicing social distancing would be a blessing.


Is It Safe? -April 13th Newsletter

Kerr Financial Group

Kildare Asset Mgt.

Jeffrey J. Kerr, CFA

Newsletter

April 13, 2020 – DJIA = 23,719 – S&P 500 = 2,789 – Nasdaq = 8,153

“Is It Safe?”

During the 1976 movie Marathon Man, Dr. Christian Szell (Laurence Olivier), asks the question “Is it safe?”  Szell is a Nazi war criminal who wants to know if he is still being pursued.   He asks the question to Thomas Levy (Dustin Hoffman) as he is torturing Levy.  Like everyone currently enduring a different torture, Levy doesn’t know the answer.

Is it safe?  Is it safe to leave the house?  Is it safe to go to a store?  Is it safe to go to work?  Is it safe to go to church?  President Trump, health officials, politicians, citizens, society, and of course, Wall Street want to know “Is it safe?”.

The world is searching for answers to situations that we have never encountered before.  How does the country function when so little is known about the cause of its closing?  What are the proper steps to ensure the safety of as many as possible?  What is the right balance of safety and civil liberties?

Here are some of the economic goings-on as we grope for solutions.  The entire country has been declared a federal disaster area.  The Cheesecake Factory restaurant chain announced in mid-March that it would not be paying April’s rent.  There are other chains and retailers who will not be making their April rent payment.

There has been an unprecedented amount of job losses.  Weekly jobless claims have totaled over 22 million people during the past four weeks with each week’s new claims exceeding 5 million.  These are astonishing numbers as the previous record 4-week total of jobless claims was 2.7 million (about 10% of the current run rate) which was in the fall of 1982.

Crude oil has plummeted to 20-year lows as demand disappears.  Entire industries are asking for assistance or a complete bailout.  Treasury bond yields have nosedived to unthinkable levels in a race to safety.  For the first time, the 3-month and 6-month Treasury bills recently showed negative yields.  Thankfully this only lasted for a brief time.

Everyone dislikes uncertainty and the markets especially detest it.  This partially explains the reaction when the news on Covid-19 started to break.  The stock market suffered its worst quarter in 12 years, and it was one of the fastest drawdowns in history.

Since then the stock markets have stabilized somewhat.  On the other hand, the credit, currency, and commodity markets have not.  Last week the stock market strongly believed that ‘it is safe’ as the S&P 500 was up 12% which was its best weekly gain since 1974.  The Dow Jones Industrial Average had its best week since the 1930’s which included a 1,600-point one day jump.  This happened in a 4-day trading week as the markets were closed for Good Friday.

Below is a table of the year-to-date returns as of April 9th.  Also included is last week’s gains for the major averages.


Is it safe?  As with Thomas Levy, we don’t know.  The bulls point to the news on Covid-19 getting less worse.  But perhaps more importantly, the Federal Reserve has been using bazookas to support the markets.  Last Thursday, as another horrible jobless claims report was announced, the Fed unveiled a new $2.3 trillion program for addition loans.  This is in addition to the previous trillion-dollar packages.

As part of this decision, the Fed also said it would be buying and supporting riskier debt than the previous efforts.  Junk bonds, states, and cities would be funded by the new program.  Many on Wall Street also viewed this as a wink and nod from the Fed and the Treasury Department.  In other words, don’t fret if this doesn’t work because we’ll keep printing money to throw at the problem.  For supporters of Bernie Sanders and Modern Monetary Theory, this is a real time version.

Since its birth in 1913, the Fed has had its critics.  Today is no different.  Current skeptics look at central bankers as both arsonists and firefighters.  Their policies have a hand in creating the economic and financial calamities that they eventually attempt to fix.

The Fed and other global central banks have suppressed the level of interest rates for the past decade.  This encouraged corporations to sell more debt at lower interest costs.  The companies then used the proceeds to buy their stock in the open market which provided a floor under their share price.  It clearly helped the stock market as well as anyone in top management whose compensation was tied to their stock price.  As a result, these companies don’t have the financial flexibility when a catastrophe happens.  As a result, they plead to the government for a bailout.

Part of the markets’ belief that ‘it is safe’ is the view that 2020 will be like 2008.  The Fed got us through that disaster so they should be able to steer us through this mess and everything will be back to what it was.  Maybe it’s as simple as that.  Besides the Fed has told us they’ll keep printing dollars and do whatever it takes.

While there are some parallels, there are some crucial differences.  The U.S. economy has never been shutdown to this level.  While this may lead to a huge amount of pent up demand that will be unleashed in the months ahead, there could be a large amount of demand destruction.  Permanently closed businesses, lost jobs, lower incomes, and higher inflation are economic possibilities.  A change in cultural behavior that offer new and different challenges would make 2020 vastly different from 2008.

In some respects, we are hopefully getting safer.  Concerning the financial and economic systems, the answer depends on one’s confidence in the Federal Reserve and our government leaders.  Those with confidence believe that Jerome Powell has the answers and the ability to address the problems.  Those without confidence believe the Fed is using the wrong or ineffective tools and that the consequences to their decisions will cause larger systemic damage.  The key question remains, “Is it Safe?”

“I’m Turning Japanese, I Think I’m Turning Japanese” -April 6th Newsletter

Kerr Financial Group

Kildare Asset Mgt.

Jeffrey J. Kerr, CFA

Newsletter

April 6, 2020 – DJIA = 21,052 – S&P 500 = 2,488 – Nasdaq = 7,373


“I’m Turning Japanese, I Think I’m Turning Japanese”i


Following World War II, the Allied forces occupied Japan until 1952.  After this the Japanese post-war economic miracle began and the recipient of the two atomic bombs recovered to become the world’s second largest economy.   The Land of the Rising Sun’s influence eventually reached across the globe in industries such as steel manufacturing, electronics, appliances, and automobiles.  “Made in Japan” took on a new meaning.

The Japanese system was widely held out as the new model of economic success.  Their management methods were studied, and books were written on how to duplicate their achievements.  As Japanese business and culture continued to spread throughout the world, it acquired high profile assets.  Within the U.S., Japanese entities bought iconic American landmarks such as the Empire State Building and Pebble Beach Golf Course.  It seemed that it was only a matter of time before Japan overtook the U.S and its declining rust belt to become the largest global economy.

This exhilarating climb in world stature was naturally reflected in Japan’s stock market.  The Nikkei 225 (the main Japanese stock market index) traded in the low 6,000’s in the early 1980’s.  It ended the decade within a whisper of 40,000.  The Nikkei had a string of 7 years of double-digit gains during the 1980’s.  This included a 23% gain in 1983, a 42% jump in 1986, and a 40% rise in 1988.  The Nikkei averaged a 20% annual advance for the 10 years of the decade. This was a remarkable and historic stock market move.

Unfortunately, markets don’t go up forever and the Japanese stock market was no exception.  The Nikkei’s record closing price was 38,957 on December 29, 1989.  Within a year (by December 1990), it has dropped 35% to below 22,000.  In 1992 it traded down to 14,300 which marked a 63% plunge in just 20 months.

The Nikkei spent much of years between 2000 and 2013 below 14,000.  In the 30 years since this collapse, the Nikkei has never gotten back above 28,000.  Books were written about Japan’s post World War II economic accomplishments.  Likewise, books have been written about Japan’s historic stock market bubble.

Below is a 40-year chart for the Nikkei 225.  It’s easy to see the miraculous 1980’s with its peak in 1989.  Of course, the plunge also stands out. Incredibly, Japanese stocks have spent 30 years in a wide range but have never approached the levels reached in the late 1980’s.

The inability for the stock market to breakout of this endless sideways slither is not because of a lack of efforts.  Japan’s government and central bank (the Bank of Japan) have thrown everything at the markets over past 30 years.  The Japanese have run large fiscal deficits, loosened monetary policy, lowered interest rates, and supported stocks.

They were among the first to try negative interest rates.  It has gotten so extreme that there have been many instances where Japanese government debt out to 10 years of maturity traded with a negative yield.

When the other programs didn’t appear to be working, the Bank of Japan turned directly to the stocks market.  The Bank of Japan (BOJ) began buying exchange traded funds (ETFs) in 2010.  Currently, the central bank’s holding in Japanese stocks is over ¥25 trillion and it is estimated that they are a major shareholder in over 40% of the Japan’s listed companies.

Despite the constant introduction of programs aimed at energizing the economy, Japan has little to show for it.  GDP (gross domestic product) growth has been less than 1% per year for much of the last decade.  While Japan remains the world’s 3rd largest economy, they have never recovered from the financial market bubble of the 1980’s.

This review of Japan’s struggles could provide help in looking at how the U.S. recovery will develop.  First, the U.S. will see much larger economic damage than what happened in the Great Depression.  Goldman Sachs and Morgan Stanley are estimating 24% and 30% drops respectively in 2nd quarter GDP.  To put this in perspective, there was nothing close to this type of contraction during the Great Depression.  The only other similar circumstance would be the Civil War but nobody kept these numbers then.

GDP wasn’t calculated in the 1860’s and there was no Federal Reserve.  And while some may yearn for such days, today’s landscape is much different.  The world’s central banks are very involved in the global economic system and the capital markets.

The Federal Reserve has distorted interest rates through their bond buying programs.  The intention was to stimulate the economy by providing liquidity to the credit markets.  Also, these bond purchases kept interest rates below levels where they would otherwise have been.  This process distorted the markets by setting one of most important economic elements (interest rates) in a manipulated structure.  The result is that a lot of mispriced debt was created.

This excess leverage becomes an exceptional burden when dealing with shocks such as the one caused by Covid-19.  Our political and monetary leaders’ response to this crisis is a case of Déjà vu.  The Fed has lowered interest rates to 0% and reinstituted bond buying programs.  Washington is setting up widespread industry bailouts, small business grants and loans, and expanded unemployment benefits.

The announced responses have been both quick as well as large.  The multi trillion-dollar packages rival the total of the various QEs (quantitative easing) that were implemented over many years.  There seems to be no limit to how far the Fed is prepared to go.

While the Fed has resisted negative interest rates (so far), the market chose to do it for them.  The 3-month and 6-month Treasury bills traded with negative yields recently.  But this was more of a flight to safety than a planned monetary effort.  Nevertheless, the Fed has included bond ETFs within the types of securities they will be purchasing.

Jerome Powell, the Fed chairman, has used the stock market as a barometer and, no doubt, that continues and has influenced this flurry of reactions.  With the S&P 500 having its worst quarter since 1938, the Fed wants to do all it can to stabilize equities. Here are the year-to-date returns for the major averages as of April 3rd.

U.S. policy makers are focused on doing everything possible to deal with this historic situation.  Many expect the recovery to result in an economy that acts like the one we had before this outbreak.  However, it is more likely that society’s behavior is changed and that our consumption habits are tempered.

Japanification is a term used to describe Japan’s deflationary bust following the collapse of the 1980’s economic bubble.  Low growth and struggling markets are the characteristics of the subsequent lost decades.  There is a debate over whether government policy made things better or worse.

The U.S. appears to be following a similar game plan as the Japanese.  An important question is will we see similar results?  Obviously, there are cultural differences that could alter our outcome from that which Japan experienced.  However, an economy dominated by government programs and management will dampen growth potential.  In this instance “Made in Japan” is not something you want to copy.

i. David Fenton, 1980


“Is There a Doctor in the House?” – March 20th Newsletter

Kerr Financial Group

Kildare Asset Mgt.

Jeffrey J. Kerr, CFA

Newsletter

March 16, 2020 – DJIA = 23,185 – S&P 500 = 2,711 – Nasdaq = 8,784

“Is There a Doctor in the House?”

March Madness has reached new levels of psychosis.  From basketball to baseball to Broadway, from ice rinks to restaurants, from Dublin to Disneyland, the world has stopped.  Welcome to a pandemic.  Beyond the crucial health issues, Covid-19 has also exposed some economic blotches.

These issues have been hiding in plain sight for some time.  Record amounts of corporate debt, burdensome levels of consumer obligations, and, of course, over $22 trillion of federal government debt with no plan to address it.  These are not shocking revelations – we’ve known about these issues for some time.  And while a growing global economy can look past such issues, shocks to financial markets have a way of changing everyone’s focus.

This is part of the reason that stocks had one of the worst weeks in history.  Stocks tumbled as the Dow Jones Industrial Average fell 10% (S&P 500 and Nasdaq Composite down more than 8% each).  Losses of this size are noteworthy enough but even more remarkable is that there were two stunning rallies within the week.

The Dow lost 2,000 points (7.79%) on Monday (March 9).  The next day the Dow rebounded over 1,100 points which happened in last couple of hours.  This was followed by a 1,400 point fall on Wednesday and another 2,000 point plunge on Thursday.  This second 2,000 point decline was the largest one day point loss in history.  On Friday the Dow jumped almost 2,000 points which was another unexpected and fast rally that took place within one hour!

In other words, the Dow’s five-day summary saw Monday fall 7.8%, Tuesday rallied 4.9% (in the last 2 hours), Wednesday dropped 5.8%, Thursday plummeted 10% and Friday jumped 9.3% (again in the last hour of trading).  Absolutely maddening.

During the week, the S&P 500 moved up or down by at least 4% for five consecutive days which is the longest stretch since 1929.  Twice within the week, stocks nosedived so fast that trading circuit breakers were triggered which halted trading for 15 minutes.  It was the first time this happened in 23 years.  These trading time-outs were intended and designed to restore calm to the exchanges.  Last week they appeared to magnify the panic.

The major stock averages have fallen from the record levels in February and show losses for 2020.  Here are the year-to-date numbers as of March 13th.


Uncertainty concerning the impact and potential damage (both health and economic) from the Coronavirus drove a lot of the selling.  The glass half full view is that the difficulties are only temporary and that stability plus a return to growth is around the corner.  Of course, the opposing view is that this we are entering unchartered waters with elevated risk of systemic problems.  The scarcity of definitive information on Covid-19 added to the media hysteria is resulting in increased the guessing and conjecture.

Of course, an encumbered system has a harder time overcoming such obstacles than a system with little or no debt.  And the current environment is a world that is awash with debt.  Below is a chart a chart of total U.S. debt as a percentage of GDP.


This chart measures debt as percentage of GDP.  As we know, GDP has been growing since the financial crisis in 2008 and 2009.  However, as the graph shows, the amount of systemwide debt has been growing at a much faster rate.  In other words, we are at record levels of debt and leverage.  Clearly this is an added burden as the markets deal with all of the uncertainty.

Global central banks have implemented emergency interest rate cuts to assist the financial system.  The Federal Reserve announced a cut in the overnight lending rate on Sunday night.  This moved the targeted rate from 1% – 1.25% to 0.0% – 0.25%.  Many Fed critics believe it was a panic move that was unnecessary.  Further they think that this decision used up their remaining ammunition.

These cuts have been largely ineffective.  In fact, some interest rates have unexpectedly moved up (Australia) after the central bank easing.  One cause of this could be financial players filling liquidity needs by selling what they can and, as the government bond markets have the most liquidity, this is what they sell.  This selling is causing pressure on bond prices and bond prices and yields move inversely.

The battle to contain and control the coronavirus is putting unprecedented stress on the economy and the financial system.  The world will overcome this crisis, but the forthcoming changes will be long lasting.  The resulting cultural landscape will be a much different one and will force many adjustments.  Unfortunately, the journey may not be near an end.

“Okay, Houston, We’ve Had a Problem Here”

Jeffrey J. Kerr, CFA


March 2, 2020 – DJIA = 25,409 – S&P 500 = 2,954 – Nasdaq = 8,567


“Okay, Houston, We’ve Had a Problem Here”


Wall Street, up for almost any challenge, took on one of the country’s toughest issues by trying to narrow the income gap.  As most know, traders, brokers, investment bankers and others that work in finance are not normally associated with transparency, forthrightness, and caring for others.  Last week, however, Wall Street, putting its self-interest aside, did its best to help the public good by tackling one of society’s biggest issues and reduced the wealth gap.

It was a top down tightening as the country’s wealthiest high-profile business leaders took a big hit to their net worth due a stock market plunge.  As reported by The New York Post (February 28, 2020), our country’s 5 wealthiest people lost a combined $36.5 billion last week.  Amazon’s CEO, Jeff Bezos, led the way by losing $11.7 billion in the 5 trading days as Amazon’s stock plunged over 10%.  His remaining net worth is estimated to be $116 billion.

The second biggest loser was Bill Gates who lost around $5.7 billion but will have to make do with the remaining $112.6 billion.  Bernard Arnault, the head of luxury goods company LVMH, saw his net worth fall below $100 billion as he lost $6.6 billion.  Other notables suffering setbacks included Warren Buffett (Berkshire Hathaway), Mark Zuckerberg (Facebook), and Elon Musk (Tesla).

This effort to try to fix one of our biggest challenges is a noble exercise.  Especially when it runs contrary to one of the goals of the finance industry – making people as rich as possible.  This display of altruism could lift Wall Street’s reputation well above others in the sewer of the public’s opinion which includes politicians and journalists.

Indeed, it was historic week in the financial markets.  Bonds yields fell to record levels and the stock market suffered its worst week since 2008.  Crude oil and many commodity prices tumbled while gold rallied.  Since the stock market highs on February 19th, the major averages have lost almost 15% by the end of the month.

The Dow Jones Industrial Average had two daily painful plunges of over 1,000 points last week (February 24th 1,031 points and February 27 1,190 points).  There is an investment adage that describes stocks taking the stairs higher and an elevator down.  To this point, the S&P 500, by the end of last week, lost 4 months of gains in just 7 trading days.

Here are the major averages loses for last week and for the first 2 months of 2020.

Uncertainty over the impact of the Coronavirus is the chief reason for the markets’ turmoil.  The economic harm will be supply chain delays and disruptions which will reduce industrial output.  ‘How much global damage’ and ‘for how long’ are two major unknowns.  In a world where the knee bone is connected to the thigh bone and the global commerce is so intertwined, the fallout could be far reaching.

These unknowns are developing within a backdrop of record levels of debt and overvalued asset prices.  Below is a chart of corporate debt (not including financial companies).[i]  We are near record levels and, importantly, there is much more debt than the mid-2000’s which contributed to the financial crises.  Critically, this debt must be serviced (interest payments made) regardless of the business conditions.  It’s a potential day of reckoning for weaker businesses.


Keep in mind this chart does not include government and personal/consumer debt.  Total federal government debt has more than doubled in the past 12 years and continues to grow.  Consumer debt levels have also swelled include auto loans, student debt and credit cards.  This is a lot of weight for the global economic system to carry.  If conditions get tight and defaults start popping up, it might lead to a domino effect that ripples outward.

The stock market’s banner year in 2019 contained some blemishes.  Of course, with stocks up more than 25%, they were easy to overlook.  One of the biggest involved the lack of corporate earnings growth.  The S&P 500 earnings grew 0.9% in 2019 compared to a 5-year average of 6.4%.[ii]  Since earnings didn’t keep up with prices, we have elevated stock market valuations.


Here is a chart plotting the total return of the U.S. stock market (black line) and the cyclically adjusted P/E ratio (red line).[iii]  The current P/E multiples have only been exceeded by the Dot Com bubble and the time leading into the 1929 crash.  To be sure, stock valuations have been high for the past year without causing any problems.  However, when a slowing economy is added to the equation, valuations can suddenly become a problem.  This could be a headwind until earnings growth begins again (which might be a while).

As stocks got sold, Treasury bonds got bought.  Yields on government bonds plummeted to record levels.  The 10-year note closed last week at 1.12% while the 30-year bond fell to 1.67%.  Both represent record low levels and illustrate a panic move to safety.  Furthermore, it’s interesting that those buying treasury bonds last week don’t appear to be concerned about interest rates moving back up because of a strong economy.

While the financial market turbulence is blamed on the Covid-19 virus, it is being magnified by years of central bank market manipulation.  The Fed, European Central Bank, and Bank of Japan have held interest rates down by printing money and buying bonds.  This has distorted asset prices higher.

Interest rates are one of the most important parts of a financial system.  They assign a price to capital as well as the return for those who invest.  They have been rigged for many years and the current stock market tumble along with the interest rate collapse could be the beginning of a correction of this market interference.

Obviously, selloffs make the market harder to figure out.  Often it is not the headlines that move prices but other less clear factors.  This could be the levels of debt the system is looking at.  The overall market regime is changing, and this may take more time to resolve.  In the meantime, Wall Street may temporarily be supporting Bernie Sanders by eliminating all the billionaires.


[i] Financial Times, February 2020

[ii] FactSet, Earnings Insight, February 28, 2020

[iii] The Atlas Investor, February 2020

“Enthusiasm is the electricity of life” – Gordon Parks

“Enthusiasm is the electricity of life”​ – Gordon Parks

Kerr Financial Group

Kildare Asset Mgt.

Jeffrey J. Kerr, CFA

Newsletter

February 18, 2020 – DJIA = 29,398 – S&P 500 = 3,380 – Nasdaq = 9,731


Tesla makes electric cars.  Their cars are a high-end product with many exciting features.  Tesla Autopilot is a driver assistance system that includes lane centering, adaptive cruise control, and self-parking.  Their supporters passionately believe they are a cutting edge technology company that is transforming the automobile industry.  Further Tesla’s “sister” companies have solar and space travel initiatives.

Tesla also produces controversy.  Elon Musk, the CEO, has been fined by the SEC for lying to investors and many think it was a token fine given the circumstances and the penalty should have been much more severe.  Upper management has been a revolving door with repeated departures in key positions such as CFO chief legal officer.  Many analysts are suspicious of the published financial statements.  Finally, complaints over quality and customer service proliferate social media.

In case you’ve been distracted by trying to keep your New Year’s resolutions, Tesla’s stock price (symbol = TSLA) has been doing very, very well.  At the end of October, it traded around $250 per share.  It touched $960 in early February.  Below is a one-year chart that shows the recent parabolic move.


From a financial perspective, Tesla is making progress.  They reported record deliveries in the latest quarter and posted an unexpected profit.  They delivered their first vehicle made in China and announced plans for a new plant in Germany.

After the stock’s almost tripling in three months, the company, who needs money, did a secondary stock offering.  Normally, a company’s stock drops with a secondary offering as current shareholders are diluted.  In other words, after a secondary offering, there is a greater number of shares to divide into the earnings which means lower earnings per share.   Hopefully, after some time and the newly raised capital is becoming productive, the stock starts to move higher again.

Tesla’s stocks suffered the typical pullback.  However, instead lasting months, Tesla’s pullback was only for a few hours.  The secondary offering price was set at $767 which translated into around $2 billion raised (investors buying the secondary offering got it at $767 per share).  This was a 4.6% discount to the previous day’s closing price.  TSLA traded down to $787 and then reversed and closed narrowly lower than the previous day and well above the secondary offering.  It was a remarkable development which left the Tesla skeptics more confused and frustrated than the Democrats.  Not an easy task!

Tesla bulls naturally credit Elon Musk for this recent stock performance and it’s logical to associate a stock’s price with the performance of the company’s management.  In this case, Tesla investors should also credit their good fortune to Jerome Powell, the Federal Reserve, and the world’s central banks.

Tesla, Uber, We Works, and other recent startups partially owe their existence to central banks.  As the global monetary bureaucrats have manipulated interest rates to record low levels and pumped the system with liquidity, there are companies that exist that wouldn’t under historically normal interest rate conditions.

As a reminder of how unusual the current financial environment is, at the end of 2019 approximately $11 trillion of bonds were priced with a negative interest rate.  The ECB (European Central Bank) and BOJ (Bank of Japan) have basically cornered the European and Japanese fixed income markets by creating currency and using it to buy bonds in the open market.

Here in the U.S., the Fed’s involvement in the repo market began in September.  Chairman Powell will not call this effort another round of easing and maintains that it is temporary.  Nevertheless, it is pushing liquidity into the system which helps the financial markets.  Here is a graph showing the recent growth in the financial assets owned by the Fed.  The spike beginning last fall is easily seen.


While TSLA’s stock has been a star, the rest of the capital markets have also done well.  The major averages are up for 2020 along with the bond market.  It has not been easy as investors have had to deal with the Senate acquitting President Trump, the fallout from the State of the Union address, the coronavirus, and corporate earnings.  Here are how the major averages are performing for 2020 as of last Friday.

The added liquidity has helped the bond markets and yields have fallen as the 10-year and 30-year Treasury yields are approaching all-time lows.  Strangely, this drop in yields is taking place within a strong economy.  Normally, falling yields are a sign of economic weakness.  Last week the 10-year note closed at 1.59% and the 30-year bond settled at 2.04%.  This move lower could be related to worries of the economic impact of the coronavirus.

Looking at earnings releases, with over 1,100 companies reporting since the first of the year, 66% have exceeded their estimated earnings number.  Almost 65% have beaten their expected revenue levels.  However, looking forward, management guidance for the future has been a net negative (more reducing guidance than raising).  This could be a function of the economic uncertainty due to the virus as well as the upcoming U.S. elections.

The financial markets look forward and attempt to discount the future.  Given the news flow and the social division, it would seem obvious that the markets would be somewhat uneasy.  But this is not the case.  In fact, the stock market is trading at record high levels.  Of course, this could be part of the Tesla thesis.  As is the case with TSLA, the liquidity provided by global central banks might be masking the reality of the markets’ risk.

Tesla has been a controversial company.  Its supporters believe they can do no wrong while their critics think it is a fraud.  This discussion is not intended to recommend or discourage purchase of TSLA but rather to point out how the company has benefited from years of central bank intervention in the financial markets.

Concerning the Federal Reserve’s involvement in the capital markets, a question to ponder is whether this interference is a permanent situation.  Many expect central banks will ultimately return to historically normal policies.  That is getting harder to believe given that the Fed has been aggressively using unconventional monetary tools for over 10 years.  If the current financial environment become standard operating procedures, investment analysis and risk management will be a lot harder.  Quantifying the ability of hundreds of Ph.D.’s who are “data dependent” along with their capability to deal with self-inflicted crises will be an impossible task.  Kind of like explaining Tesla.


3rd Quarter Review Letter

KERR FINANCIAL GROUP

KILDARE ASSET MANAGEMENT

45 Lewis Street, Lackawanna RR Station

 Binghamton, NY 13901

The following is a copy of the 2019 3rd quarter letter sent to clients. It reviews the markets and the client account’s activity and performance for the 3rd quarter of 2019.


On July 31, 2019, the Federal Reserve cut the key short-term interest rate (federal funds rate) by one-quarter of one percent (0.25%). This was the first cut in over 10 years. The last cut was on December 16, 2008 as the Fed was responding to the global financial crisis. That cut reduced the fed funds rate to 0%.

Interest rates are one of the common tools used by those in charge of monetary policy. When the economy is slowing or contracting, interest rates are reduced in order to stimulate conditions. A central bank (the Federal Reserve in the U.S.) usually has a direct control on the short-term rates only. Reducing this rate normally results in more liquidity in the banking system which is expected to make its way into the financial system and encourage businesses to expand and hire more workers.

Central banks also use interest rates to slow down an economy that is expanding too rapidly. There is constant fear that strong growth might cause inflation. Higher interest rates increase the cost of capital and, generally, dampen business activity.

When the fed cut the fed funds rate to 0% in December 2008, the rate stayed there until December 2015, when it was raised one-quarter of one percent (0.25%). Since the first-rate hike, it has made its way back to 2.5% over a series of 9 raises with the taking place last December.

This latest interest rate cut was not your run of the mill type fed decision. Like a detective mystery, controversy and intrigue surrounded the announcement. First, many wondered why a cut was necessary when the unemployment rate is at record low levels and the economy is expanding. This led others to questioned if the Fed knew of a situation like an impaired financial institution or government that would increase stress on the global system.

Some wondered if Fed Chairman Jerome Powell was caving to pressure from the White House. The central bank claims independence from political influence (although there have been previous times that call this into question). Nevertheless, throughout the spring, President Trump posted a series of tweets calling for the Fed to lower interest rates. The president pointed out that the U.S. had the highest interest rates in the world and projected that the economy would be doing even better if the Fed lowered interest rates close to our international competitors.

The inverted yield curve within the U.S. treasury market could be another reason behind the July rate cut. Inversion means that bonds with short maturities have higher yields than longer maturities. Within normal fixed income markets, bonds that mature further in the future have higher yields than shorter maturing securities. This is to compensate for the increased uncertainty that comes with longer time frames.

Inverted yield curves, especially as measured by the difference between the 10- year Treasury note to the 2-year Treasury bill, are important. Historically, when inversion occurs between these two bonds, a recession follows. The Treasury yield curve was inverted in the spring and this could be another reason behind the July cut.

The Federal Reserve is the most powerful among the global central banks. And while central banks are traditionally focused solely on their economy, the U.S. central bank has an undefined role as the world’s central bank. This is supported by the fact that the U.S. dollar is the world’s reserve currency. With our interest rates being the highest in the world, the cost of acquiring needed greenbacks has becoming painful. This may have played a big part in the reducing interest rates in the U.S.

As significant as the July rate cut was, two more cuts have followed (one in September and one in October). Furthermore, the markets are expecting another cut in 2020. Meanwhile, the economy has not stumbled and continues to expand. Clearly these three cuts have lowered the amount of ammunition available. If interest rates are the chief mechanism in monetary policy, the Fed has 150 percentage points less to work with when the real problems arrive.

Of course, this assumes that the Fed is bound by 0% as the lowest level for interest rates. A large amount of the world’s debt currently carries a negative interest rates which leads to the question will the U.S. adopt negative interest rates. At a recent press conference, Jerome Powell declared that we won’t be needing negative interest rates and that there are other tools to use.

Still it is a situation to consider. Europe and Japan have had negative interest rates for several years and their economies have not imploded. On the other hand, they haven’t done exceptionally well. Negative interest rates in the U.S. could be a much different condition in the global financial system given our stature and critical role. If this were to occur, it could result in a loss of confidence. This would likely lead to large economic disruptions and financial system turmoil U.S. bond yields moved lower during the 3 rd quarter. The 10-year Treasury note began July at 2% and ended September at 1.67%. Likewise, the 30-year Treasury bond moved from 2.53% to 2.12% during the three months.

These may not seem significant but, for the bond market with its reputation as a lower risk asset class, these are big moves. This would be considered high volatility during any year for fixed income but, remember, this happened in three months.

While the bond market rallied (lower yields mean higher bond prices), the stock market zig zagged during the quarter. The major averages rose to all-time high levels in July but declined in August. This was followed by another move higher in September, but this reversed in the middle of the month and prices retreated. By the end of the quarter, stocks closed marginally higher from where they began July. Here are the numbers for the quarter and year to date.

Using a size weighted average, here is how the average Kildare Asset Management-Kerr Financial Group client’s account performed. This is calculated after all fees and expenses.

                                                                                              3rd Quarter       YTD

Kerr Financial Group- Kildare Asset Management-              -4.37%        6.31%


Stocks have enjoyed a very good year. In fact, for the first 9 months, the S&P 500 is having its best year in two decades. However, 2019’s gains are basically recapturing the losses for the 4th quarter 2018. The markets suffered wide significant losses at the end of last year. Here are the numbers for the major averages during the last three months of 2018.


Looking at a 52-week measurement gives a more subdued picture as compared to the 2019 year-to-date. Over the past 52-weeks (the end of September 2018 vs end of September 2019), the Dow and S&P are up only 1%, the Nasdaq is flat, and the Russell 2000 is down almost 9%.

During these time frames the indexes with the large companies have outperformed broader indexes. For both the 2019 year-to-date and the 2018 4th quarter data shown above, the large cap indexes did better than the Russell 2000 (the index with the most number of stocks of the 4 listed).

The S&P 1500 is an index that is comprised of the S&P 500 (large cap) the S&P Midcap 400, and the S&P 600 Smallcap 600. It offers a farther-reaching view of the U.S. stock market. This index provides a less exciting situation. The S&P 1500 is up 1.3% during the past 52 weeks. Going back to the end of 2017 (1¾ years) this average is up 10.4% or a little more 5% per year. If we measure from Lee’s IRA -6.34% 9.44% the highs in January 2018 (again almost 2 years), this index is up less than 3% or less than 1.5% annually if we count it as a 2-year stretch. This is a much different market than looking at 2019’s first 9 months.

Turning our view forward, there are many cross currents within the capital markets. Perhaps the largest is the social and political divide which has resulted in an impeachment inquiry of President Trump. Also, there is ongoing protests sitting governments in Hong Kong, Paris, Spain, and Chile. Brexit drags on with no resolution in sight. Tariffs and trade disagreements are extending longer than many had forecast.

Despite this list of bad headlines, the markets hold near record levels. Within the 3 rd quarter, there were plenty of opportunities for the pessimists to gain control and push stock prices lower. The bears weren’t able to succeed. That is not a claim that the sellers can’t return, but they may have missed their chance.

As mentioned, the economy continues to expand and, with lower interest rates, could accelerate that rate of growth. Although these are not normal times, markets usually don’t encounter material declines in election years. Further, the excitement and interesting news flow will carry on. It promises to be a fascinating end to this year and 2020. There will be opportunities and we will continue to work hard to find them.

Please feel free to call with any questions. Thank you for your business and continued confidence placed in me.


Sincerely,


Jeffrey J. Kerr, CFA

“All in All, You’re Just Another Brick in the Wall”

Kerr Financial Group

Kildare Asset Mgt.

Jeffrey J. Kerr, CFA

Newsletter

December 9, 2019 – DJIA = 28,015 – S&P 500 = 3,145 – Nasdaq = 8,656

“All in All, You’re Just Another Brick in the Wall”[i]

Forty years ago, in 1979, the alternative rock group, Pink Floyd, recorded the cutting-edge album “The Wall”. This was their 8th album and was both commercially and critically successful. It was produced in the form of a ‘rock opera’ and became an iconic album in rock and roll history.

Remaining relevant after 4 decades is an accomplishment in anything but especially in the music business. Amazingly the fans of Pink Floyd (and “the Wall”) have grown over those years. However, it’s unlikely that these followers appreciate (if they can remember) the environment from which the album was made. It was a much different world. Inflation was raging, the Iranian government was holding 52 Americans hostage, disco was in, and everyone waited to make long distance phone calls on Sunday nights because that’s when the rates were reduced. An improbable backdrop for classic rock album.

Of course, walls have meaning in the financial markets and it goes beyond the address of the New York Stock Exchange (Wall Street). Perhaps a better analogy is the old adage that the stock market climbs a “wall of worry”. This wall refers to a barrage of bad news in which stock prices inexplicably and illogically rise.

The current stock market is a textbook example of climbing a “wall of worry”. Every aspect of our lives is seemingly filled with animosity and pessimism. Unquestionably, there is a raging bear market in civility.

Economically, there is some troubling news. Corporate profits are contracting as S&P 500 earnings growth is slowing. In the 3rd quarter, S&P 500 earnings declined around 2% as measured year-over-year.  Furthermore, it was the third consecutive quarter that Y-O-Y earnings declined. This marks the first time that this has happened since the end of 2015 through Q2 2016.

Another concern is that projected business investment is weak. This is an important indicator as long term investments have far reaching positive economic impact. Companies have been reluctant to commit to long term investments because of general uncertainty.

Purchasing manager surveys have been feeble. The latest ISM Manufacturing survey has been below the 50 level for the past several readings. These levels are normally associated with recessions.

Outside the economy, cultural malaise represents a large section of the stock market’s wall of worry. Conflict and discord are not normally associated with strong economic conditions and we are in a stong bull market in differences of opinion.

The House of Representatives effort to impeach President Trump has widened the societal division as the opposing sides have moved farther apart as the process has played out. If the House impeaches it will only be the third time that is has happened Presidents Johnson and Clinton). This will be the first time that a president is impeached in his first term.

Unfortunately, impeachment may become a regular part of Washington’s legislative schedule. If President Trump wins a second term and the Democrats maintain the majority in the House, Democratic leaders have stated they will impeach the President again.

Away from the impeachment, the general political landscape is poisonous. Insults, ridicule and blame are the daily norms of American politics. It is no wonder that Congress’s approval rating has been below 20% for most of 2019.

Beyond our borders, there are definitive examples of unrest. Hong Kong streets are filled with freedom protesters. The yellow vest movement has been active in Paris’s street for over a year as they call for President Macron to resign. A partial list of other areas experiencing protests includes Chile, India, Iran, Iraq, Russia, and Spain.

Another formidable portion of the wall is related to trade wars and tariffs. Rumors and reports of possible escalation of tariffs and other restrictions on international trade have been a big drag on corporate forecasts. Further this has increased concerns that tariffs will result in much higher prices for imported goods leading to higher costs and lower profits. Also, it could also be a headwind to the overall consumption.

It would be logical to assume seem that the financial markets would be in a similar tumultuous state. Instead the stock market is having a historic year and bond yields have moved lower. In other words, a classic case of the stock market climbing a wall of worry. Here are the major indexes year-to-date performance.

While stocks have had a terrific year, there is a slight distortion. Some of this rally is a rebound from a painful 2018 4th quarter where the markets plunged 20%. Nevertheless, stocks have had a good year despite a deteriorating news flow.

Of course, there has been good news that has assisted the U.S. stock market as it climbed its wall of worry. The job market is the best in a generation and the economy is growing although at a slower pace than a year ago. However, it’s hard to reconcile all time high stock prices with the negative headlines.

Another important part of this dynamic is that this bad news could be already discounted. This is a subjective view that is difficult to quantify. But if the news is prevailing and widely known, it’s likely that it has been acted upon. If that is the case, it could result in a situation where the pressure from the sellers has dried up. This can create a vacuum where prices move higher.

Another explanation is that the three recent interest rate cuts by the Fed will provide the needed economic support for 2020. Stocks discount the future and this 2019 rally could be in anticipation of this next growth spurt.

Predicting where and when this move ends is baffling. Recent selloffs (August and October) have been shallow, lacked follow through and were quickly reversed. This points to weakness by the bears. However, unless the economic data begins to support the record stock price levels, there is increased risk as stock prices move higher.

“In Everything, Give Thanks”

Kerr Financial Group

Kildare Asset Mgt.

Jeffrey J. Kerr, CFA

Newsletter


November 18, 2019 – DJIA = 28,004 – S&P 500 = 3,120 – Nasdaq = 8,540


“In Everything, Give Thanks”[i]


Wall Street has much to be thankful for.  The stock market is having a great year.  Fees from IPO’s, mergers, and deals are ringing the cash registers.  Corporate earnings remain good.  The Fed has returned to cutting interest rates and pumping money into the system.  And presidential tweets still move the market higher.

Just in time for Thanksgiving, all three major indexes finished the week at all-time highs.   In late October stocks broke out of a trading range that dated back to the spring and climbed to new records.  Friday was the 7th record close in November and the 22nd for 2019.

The stock market momentum has caught many off guard as concerns about impeachment, global protests, and some slightly softer economic data increased skepticism.  In addition to being unexpected, the move has been widespread with international stock markets rallying too.

As a part of these records, the Dow Jones Industrial Average closed above 28,000 for the first time.  It’s only been 4 months since it crossed 27,000. Of course, the percentage move required to move 1,000 point Dow points is much less at large numbers and it only needed a 3.7% move above this threshold.  Below is a chart showing the moves between 1,000 point increments for the Dow.  It also gives the percentage between the milestones.[ii]

As a painful reminder, 1,000 milestones aren’t always easy to hurdle even when it represents a small percentage move.  For example, it took almost 6 years for the Dow to move from 14,000 to 15,000 (a 7% move) as the financial crisis ravaged the markets.

The latest corporate earnings reports helped the stock market move to record levels.  In the 3rd quarter reports, 64.8% of companies exceeded their earnings estimate.  This is in contrast to the 2nd quarter numbers when less than 60% of the companies beat their estimate.  This 3rd quarter success rate might be a sign that the lower earnings in the 2nd quarter earnings was a one-time event.

Expenses can be managed and adjusted which can help make the bottom line hit the quarterly forecast.  Revenues aren’t as easy to massage so investors closely watch these numbers as well.  In the 3rd quarter, 57.9% of the companies beat their sales estimates.  This is a higher rate than the 1st and 2nd quarter but lower than the high numbers in late 2018 and early 2019 when almost 70% of reporting companies were exceeding their revenue estimates.  If the outlook for corporate earnings remain positive, stocks should continue to push higher.

Here are the year-to-date returns for the major averages.

Unlike Thanksgiving, this rally has global participation.  International stock markets are having good years and are moving higher with the U.S.  The major indexes in Australia, Canada, France, Germany, and Japan are all near 52-week highs.  Among developed economies, the United Kingdom and Spain are positive for 2019 but behind the returns from other markets.

While there are not many turkeys in the developed international sector, not all of the emerging market sector have enjoyed the rally.  Russian (up 35%), Brazilian (up 21%) and Indian (up 12%) investors are thankful, but some markets are not so rewarding.  Chile is down 7.4% this year and Hong Kong is ahead by less than 2%.

Returning to the U.S., Black Friday, the second uniquely American holiday in November, is upcoming.  This official start to Christmas and holiday shopping is late this year as November 2019 has 5 Fridays.  This has some retailers worried about the decreased number of days between Thanksgiving and Christmas.  Given that smartphones and computers are strong alternatives to driving to a store, it would seem that there will not be a shortage of time.

Below is a chart showing the growth of “clicks” and the decline of traditional buying of general merchandise.[iii]  From the peak around 2009, “bricks” shopping has been in a steady decline and was overtaken in recent years by the online purchases.  These trends are likely to continue as retailers have widely invested in their online experience and shoppers are comfortable using their phones and computers for shopping.

In a report last week, retail sales rose 0.3% in October which reversed a drop in September.  It signaled increased confidence in the U.S. consumer which is a large part of the economy.  This is a welcome sign for 2019’s holiday shopping and could drive further overall economic growth.  It could easily continue in 2020.

The bulls have much to be thankful for.   It’s been a great year and the recent breakout for U.S. stocks likely signals the direction for the rest of 2019.  That’s not to suggest it will be a smooth, steady climb but it appears that the downside is limited.  Furthermore, professional investors who are underperforming the indexes will be anxious to use any pullback as an opportunity to put money to work.

On the other hand, the bears, naturally, aren’t so grateful.  To be sure, there will come a time when they will be on the right side of the markets.  But in the meantime, let’s hope they can enjoy some turkey and watch some football.

[i] 1 Thessalonians, 5:18

[ii] Charlie Bilello, November 15, 2019

[iii] The Bespoke Report, November 15, 2019